
A SMART Way to Create Management Zones Reflecting Soil Variability
With SMART4D, field variability is mapped accurately, efficiently, economically, and at high resolution; enabling variable rate inputs such as seed, fertilizer, soil amendments and more.
For farmers: quality zone maps that reflect field variability, enabling variable rate technology and maximizing the effectiveness of crop inputs.
For consultants and service providers: a white-label zone creation service with fast turn-around (compared to other methods dependent on in-field sensors). Save on labor, hardware, and streamline your precision program while providing a quality zone creation offering to your farmer clients. Zones can be as simple or detailed as desired.
Elements of the SMART4D Philosophy:
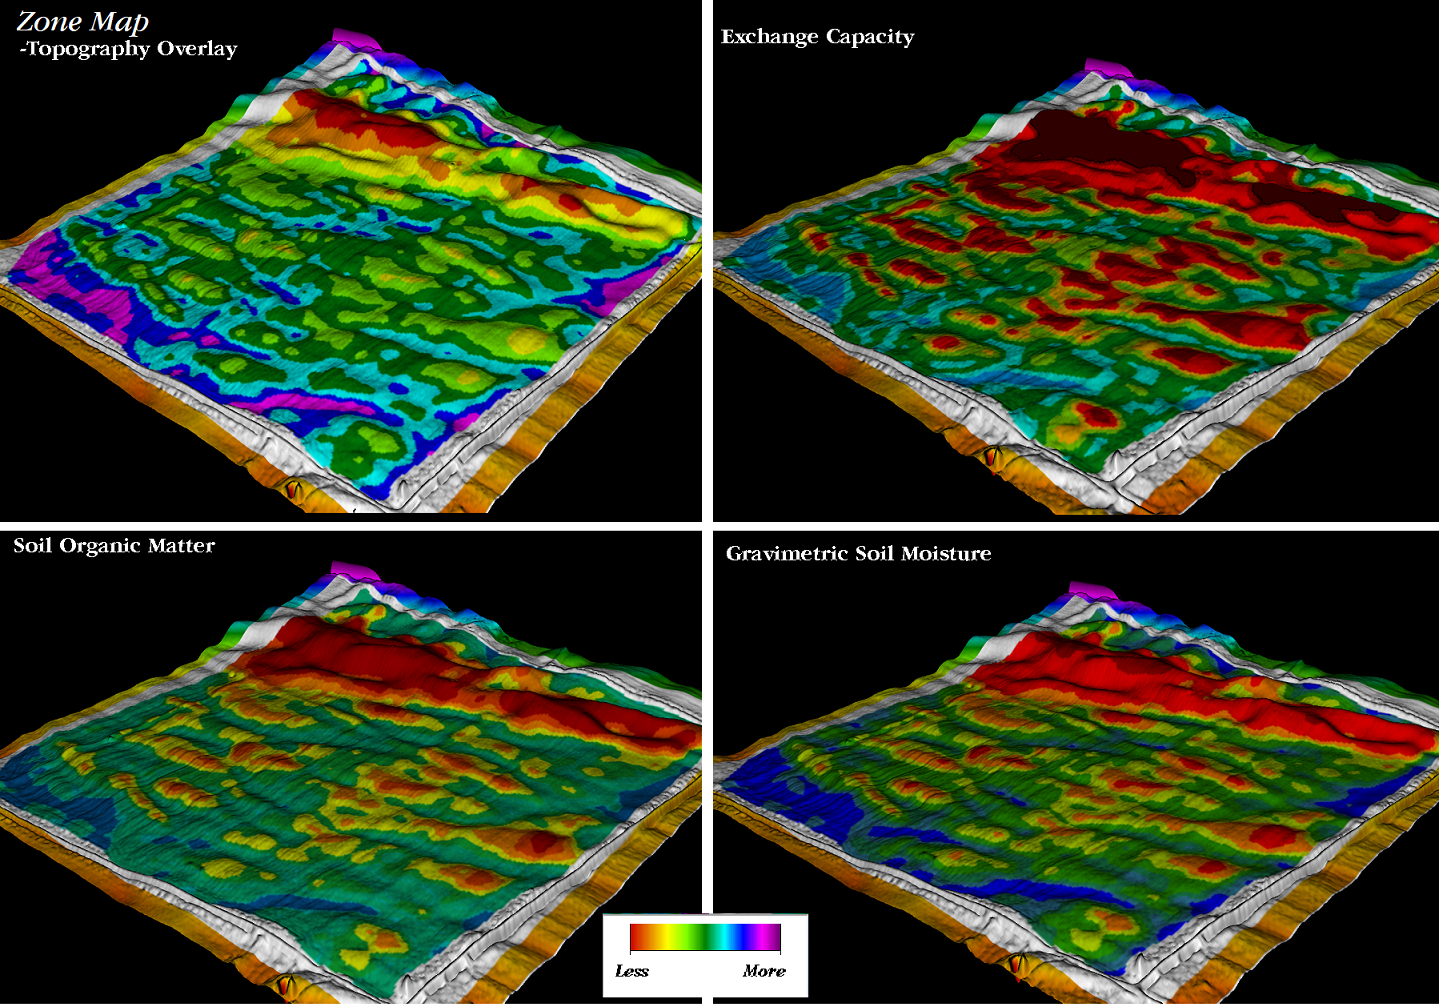
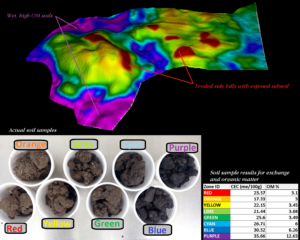
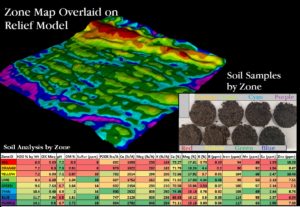
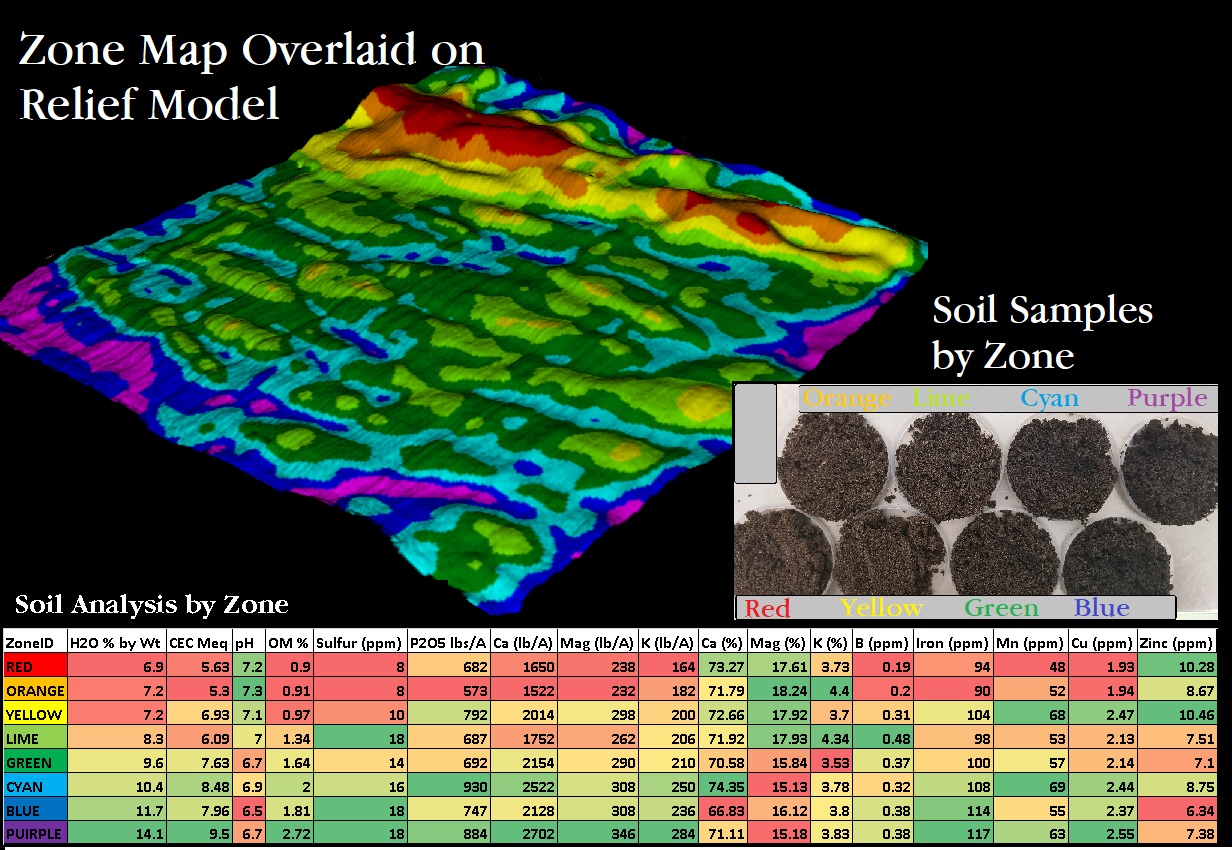
SOIL
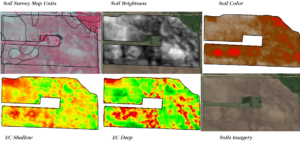
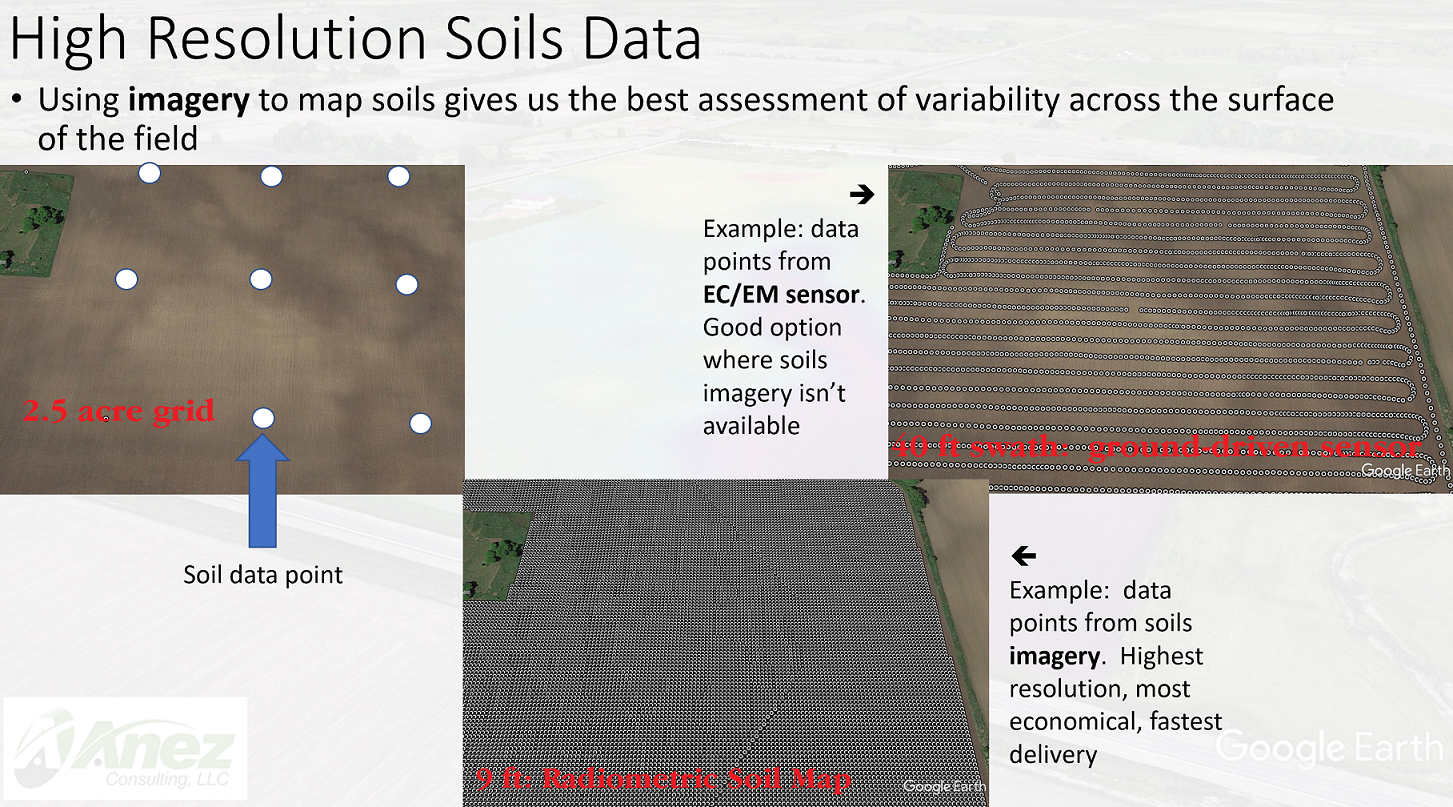
If you want to variable rate apply fertilizers and soil amendments, mapping the soil accurately is of utmost importance.
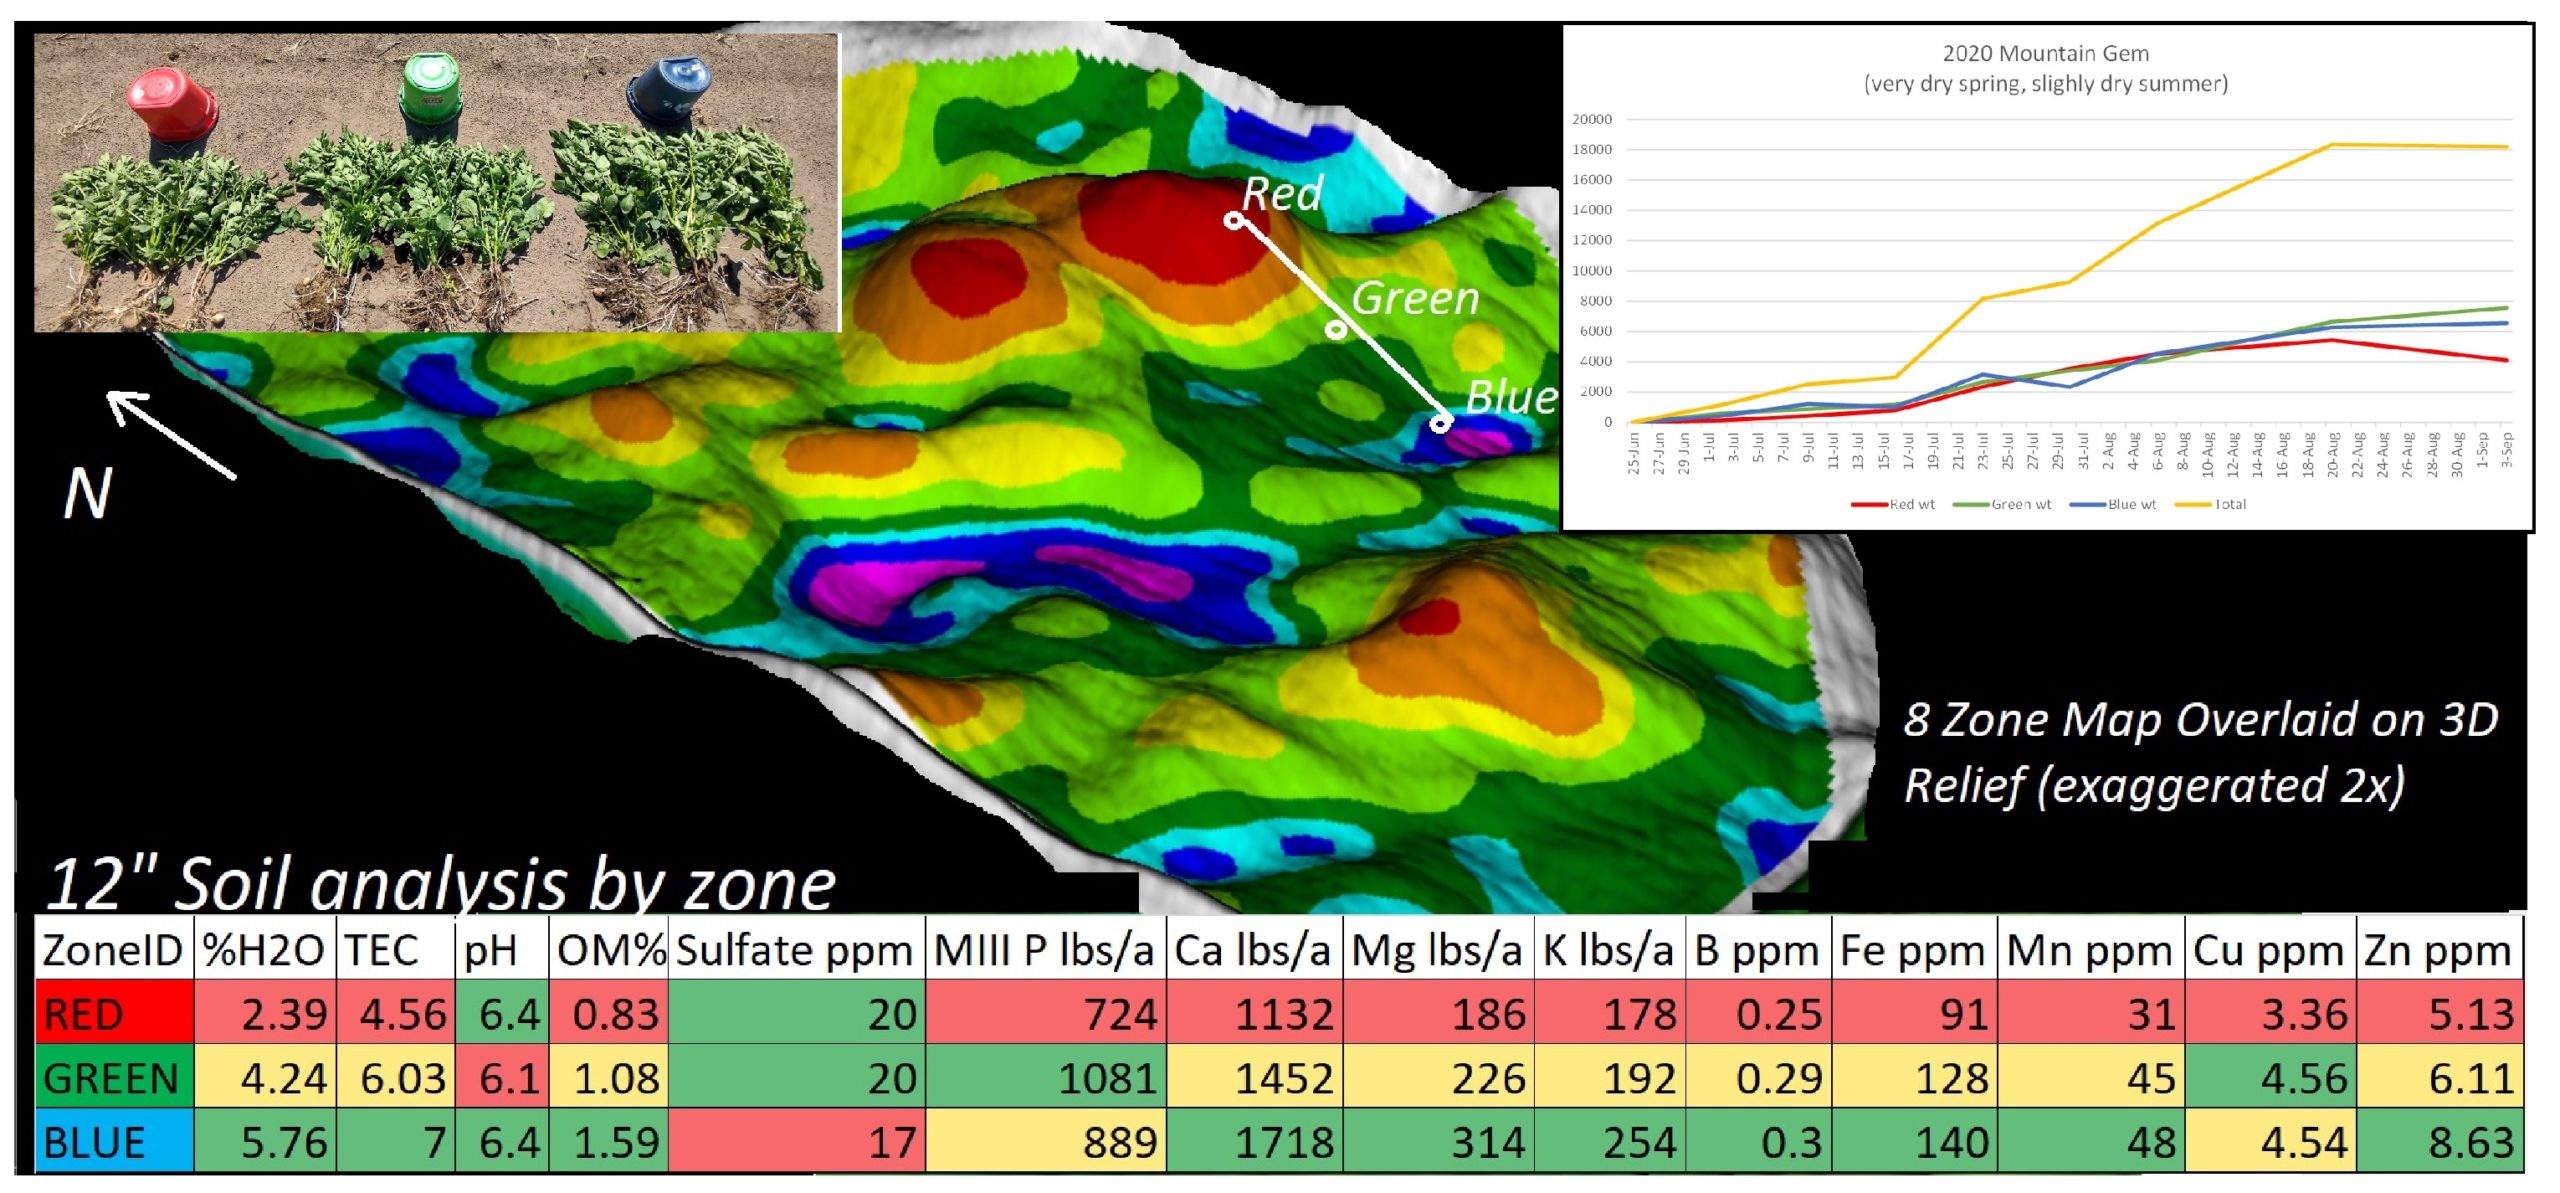
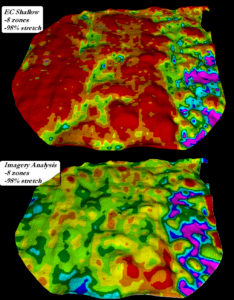
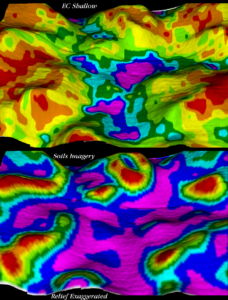
We view soil variability as a multi-dimensional challenge and assess soil brightness and soil color as well as electrical conductivity (where the situation calls for EC).
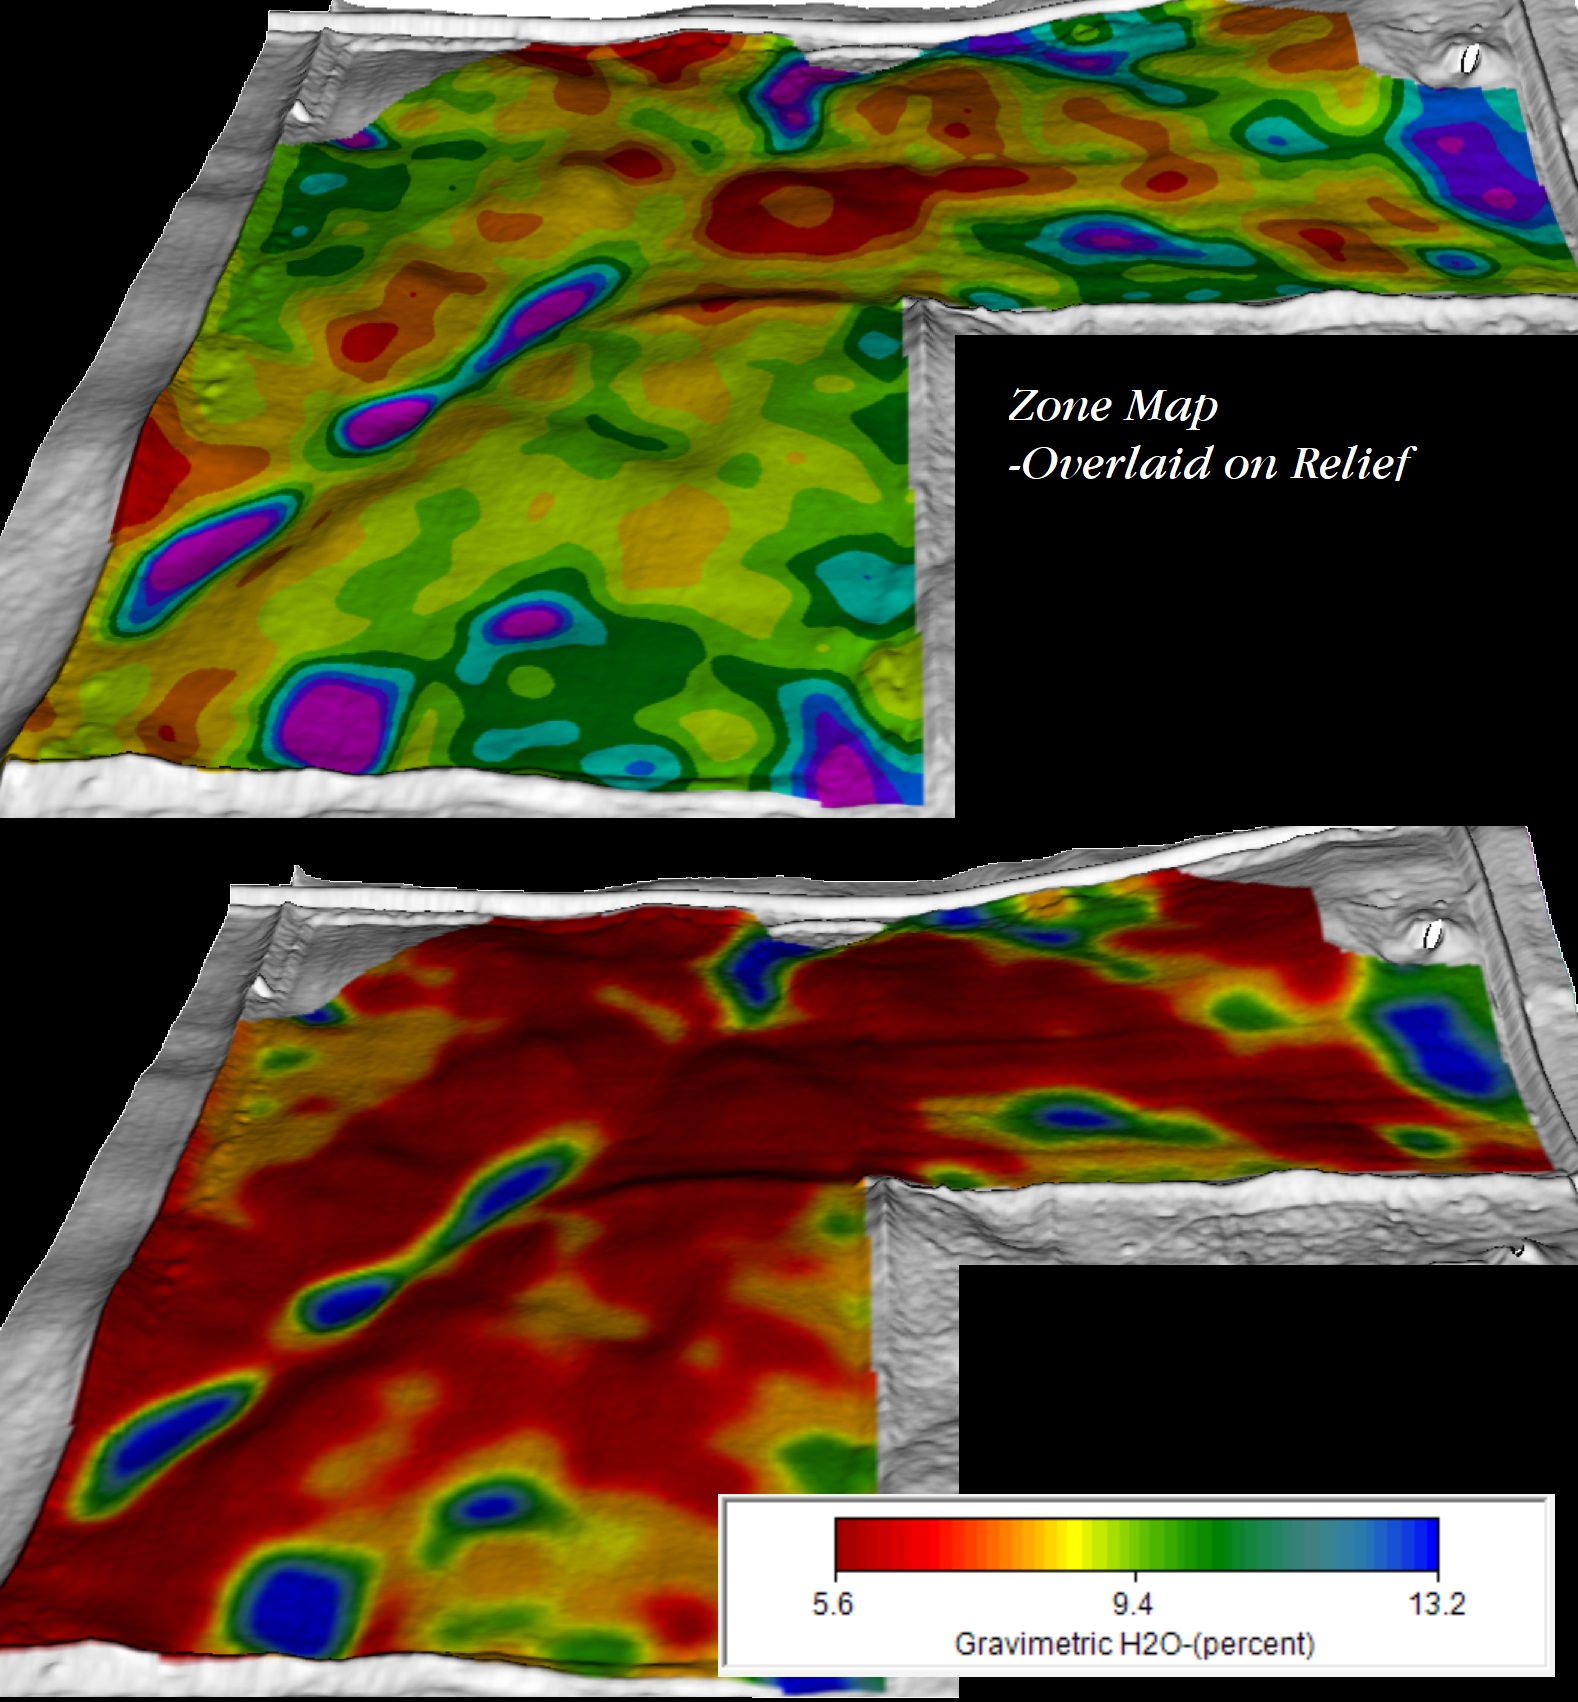
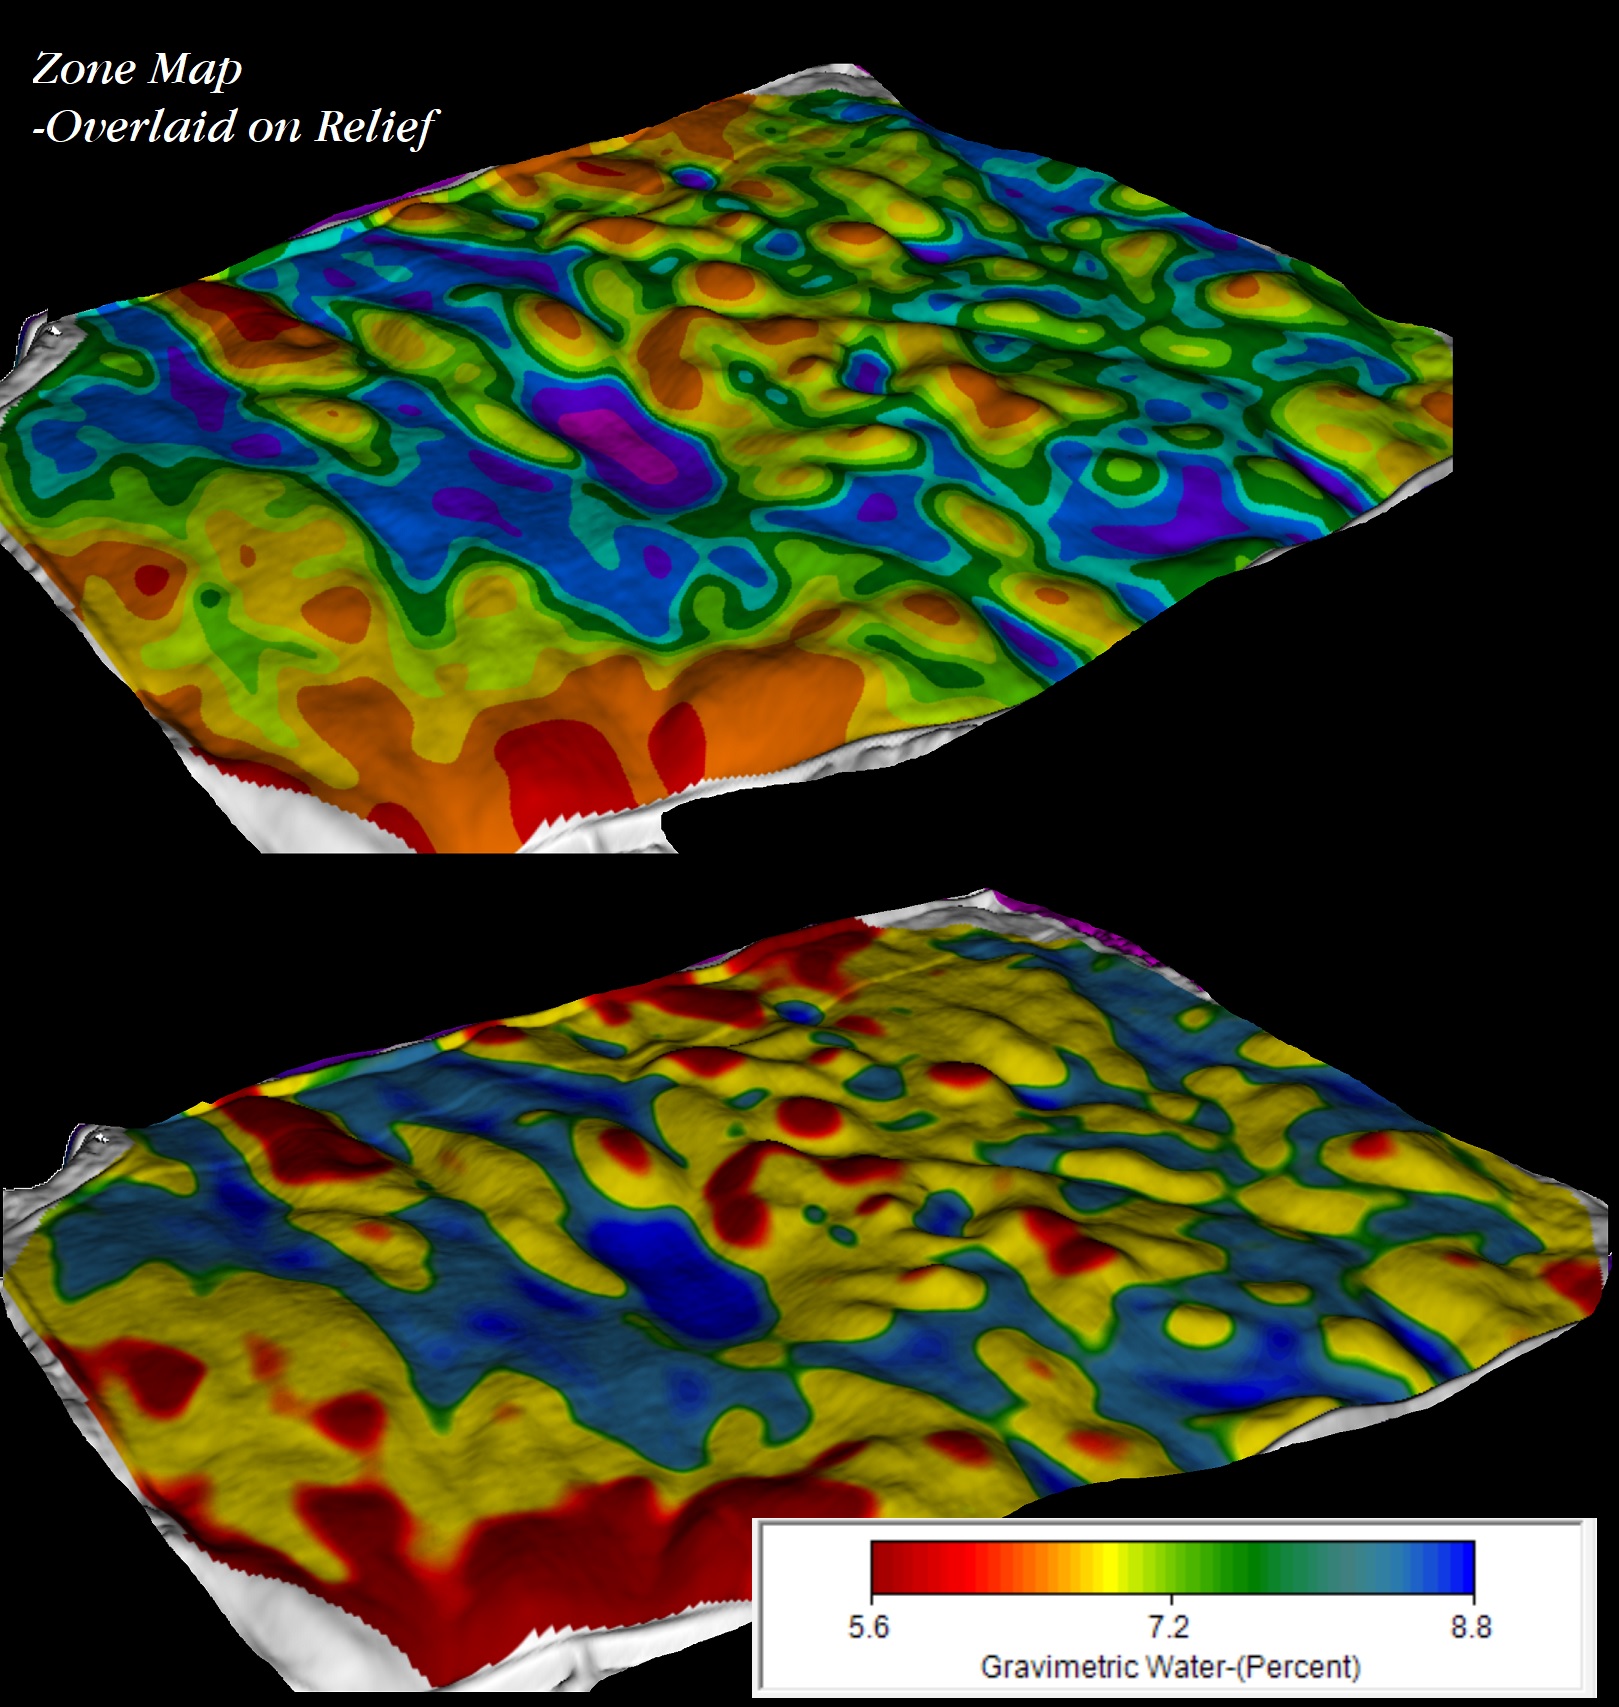
MOISTURE
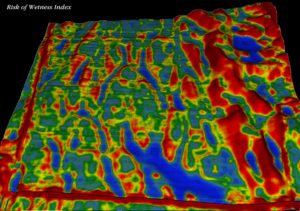
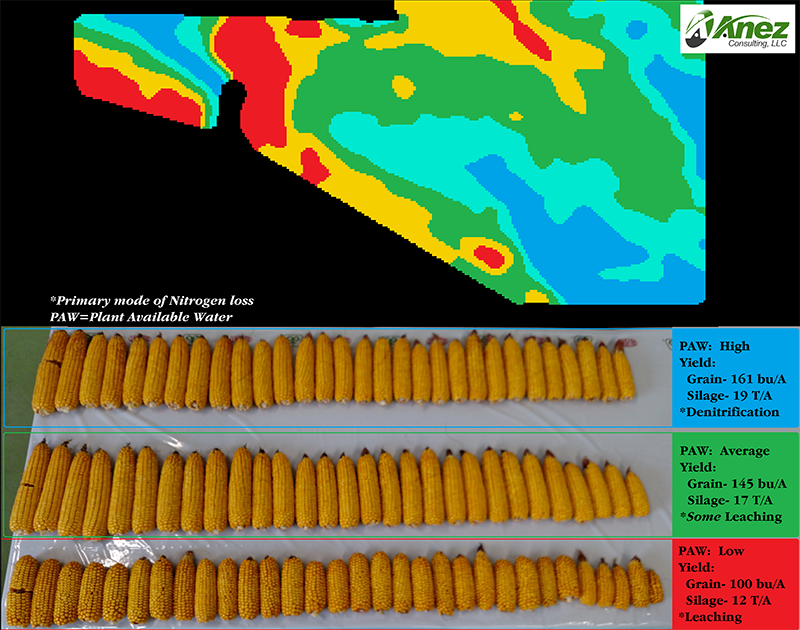
Moisture drives everything. Soil biology, as well as many chemical interactions in the soil, is dependent on moisture to function. In addition to surface flow modeling, we employ other data layers to infer soil moisture, especially in instances where surface flow of moisture is not as much of a factor, such as very sandy soils or soils with high infiltration rates.
If you want to accurately variable rate apply seed and irrigation, mapping soil moisture is imperative.


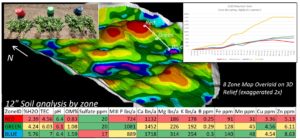
AGRONOMY
Agronomic principles are not only key to identifying and merging relevant farm data, but they are critical to implementing an effective precision ag program.
Management zones should be fine-tuned to match the farmer’s management goals, soils and climate, among other variables.


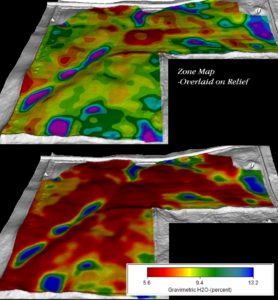
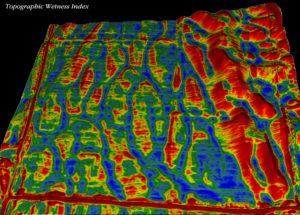
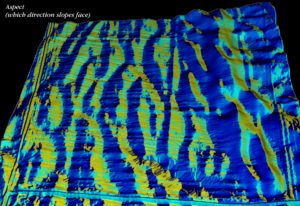
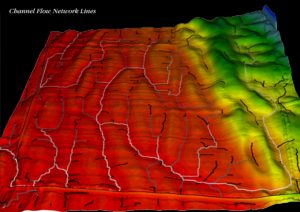
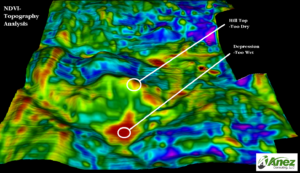
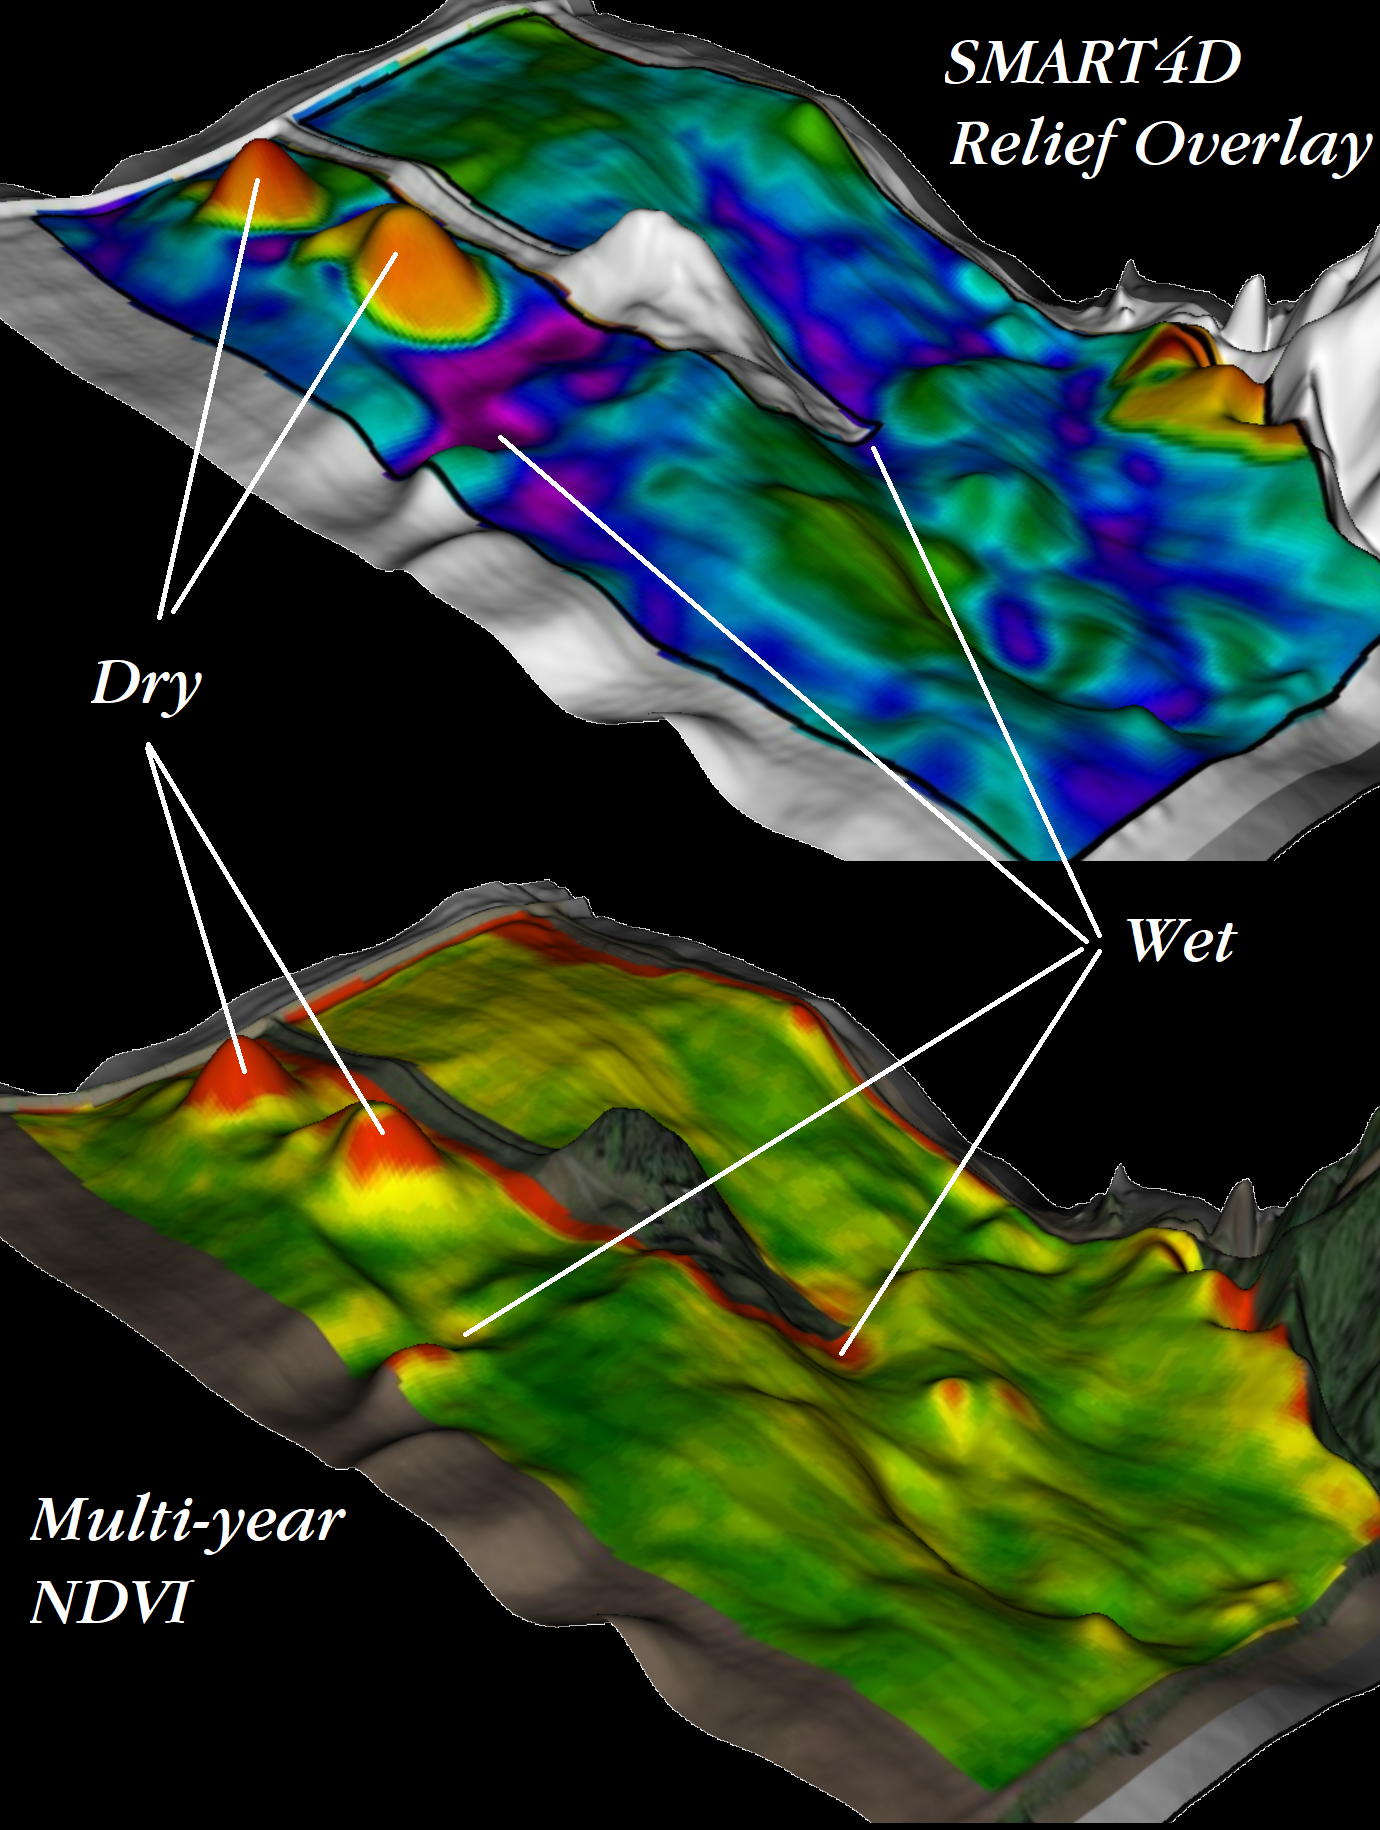
RELIEF
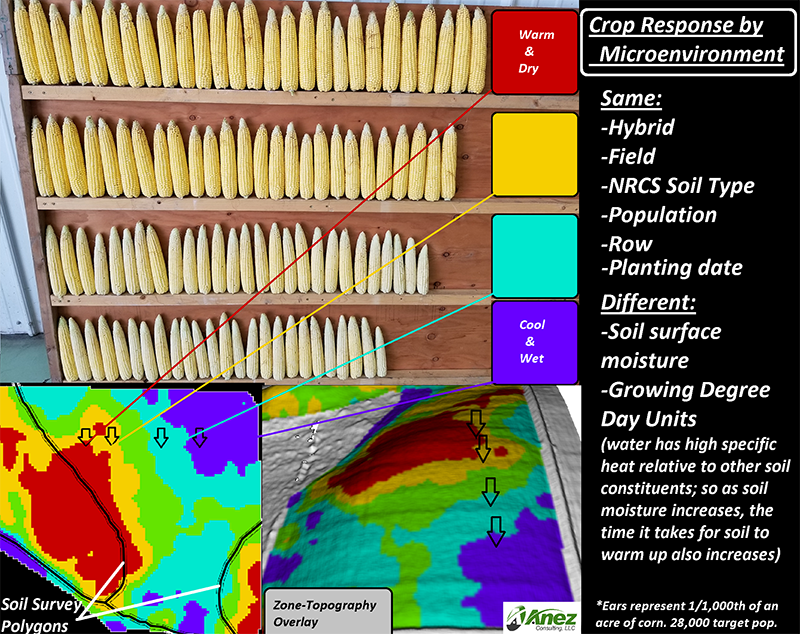
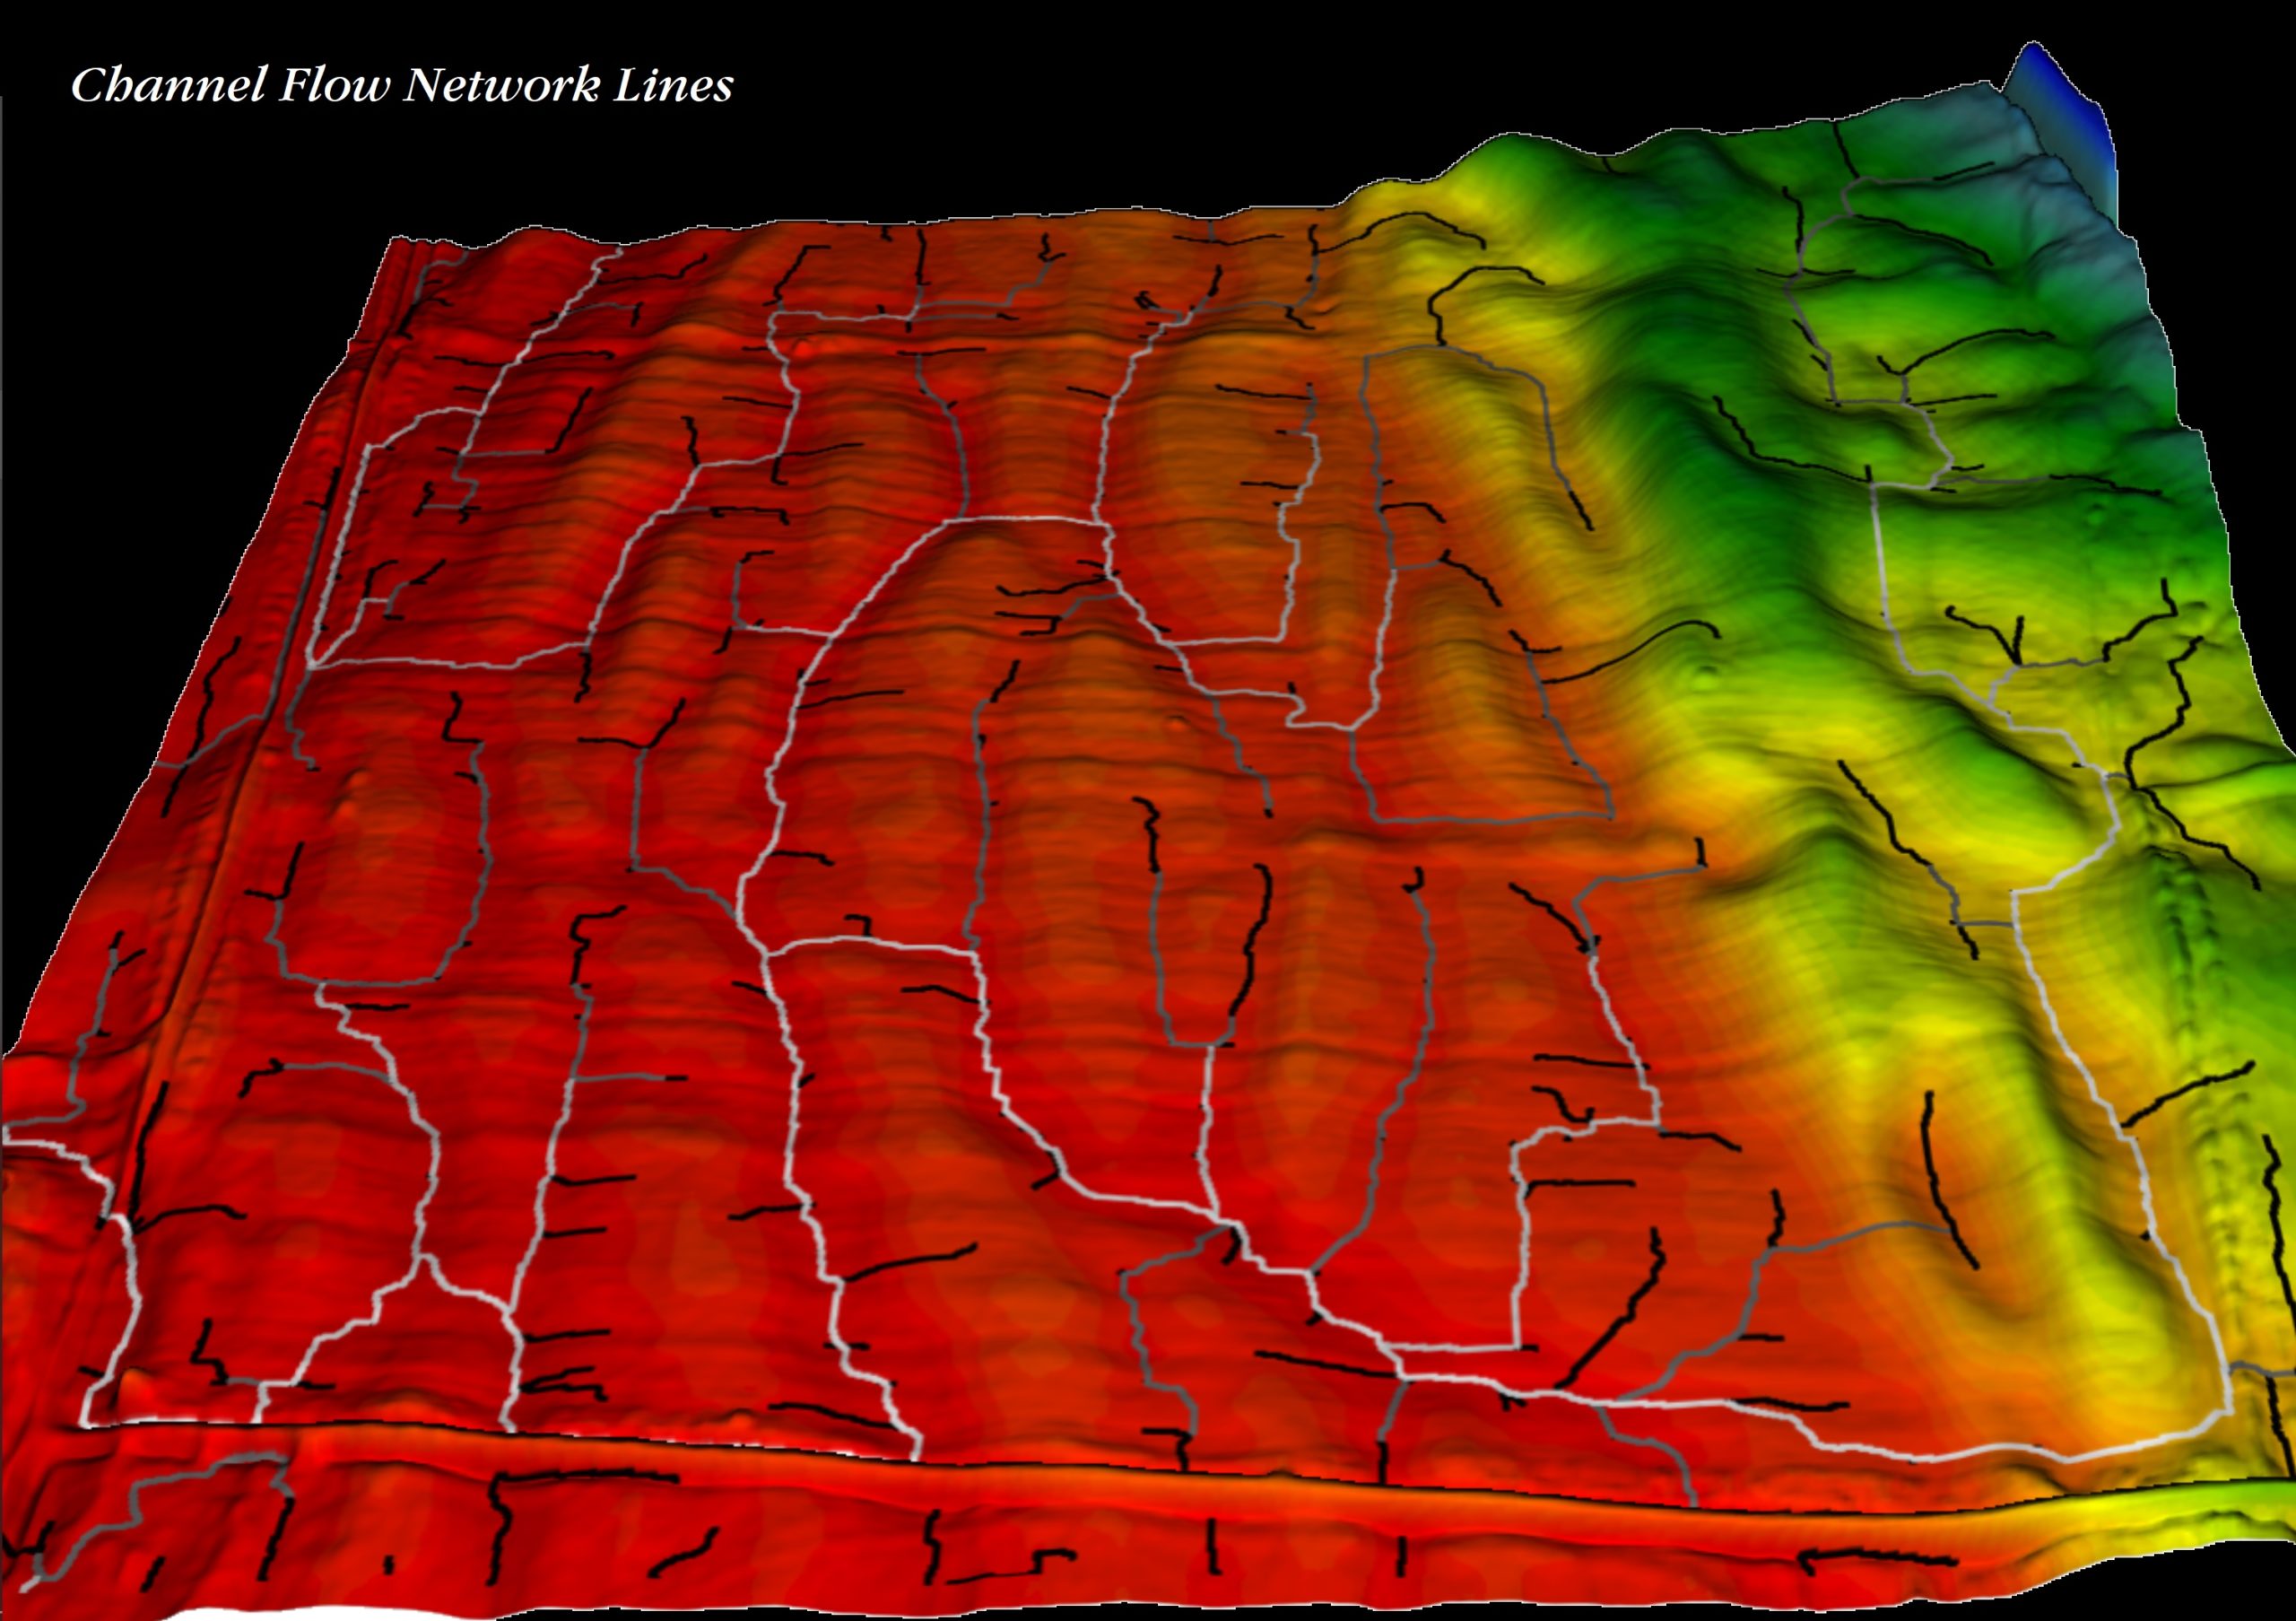
Relief, or topography, is important for several reasons. Most importantly, relief is responsible for the movement of water over the surface of the field, which drives temperature, biological activity, nutrient use efficiency and more.
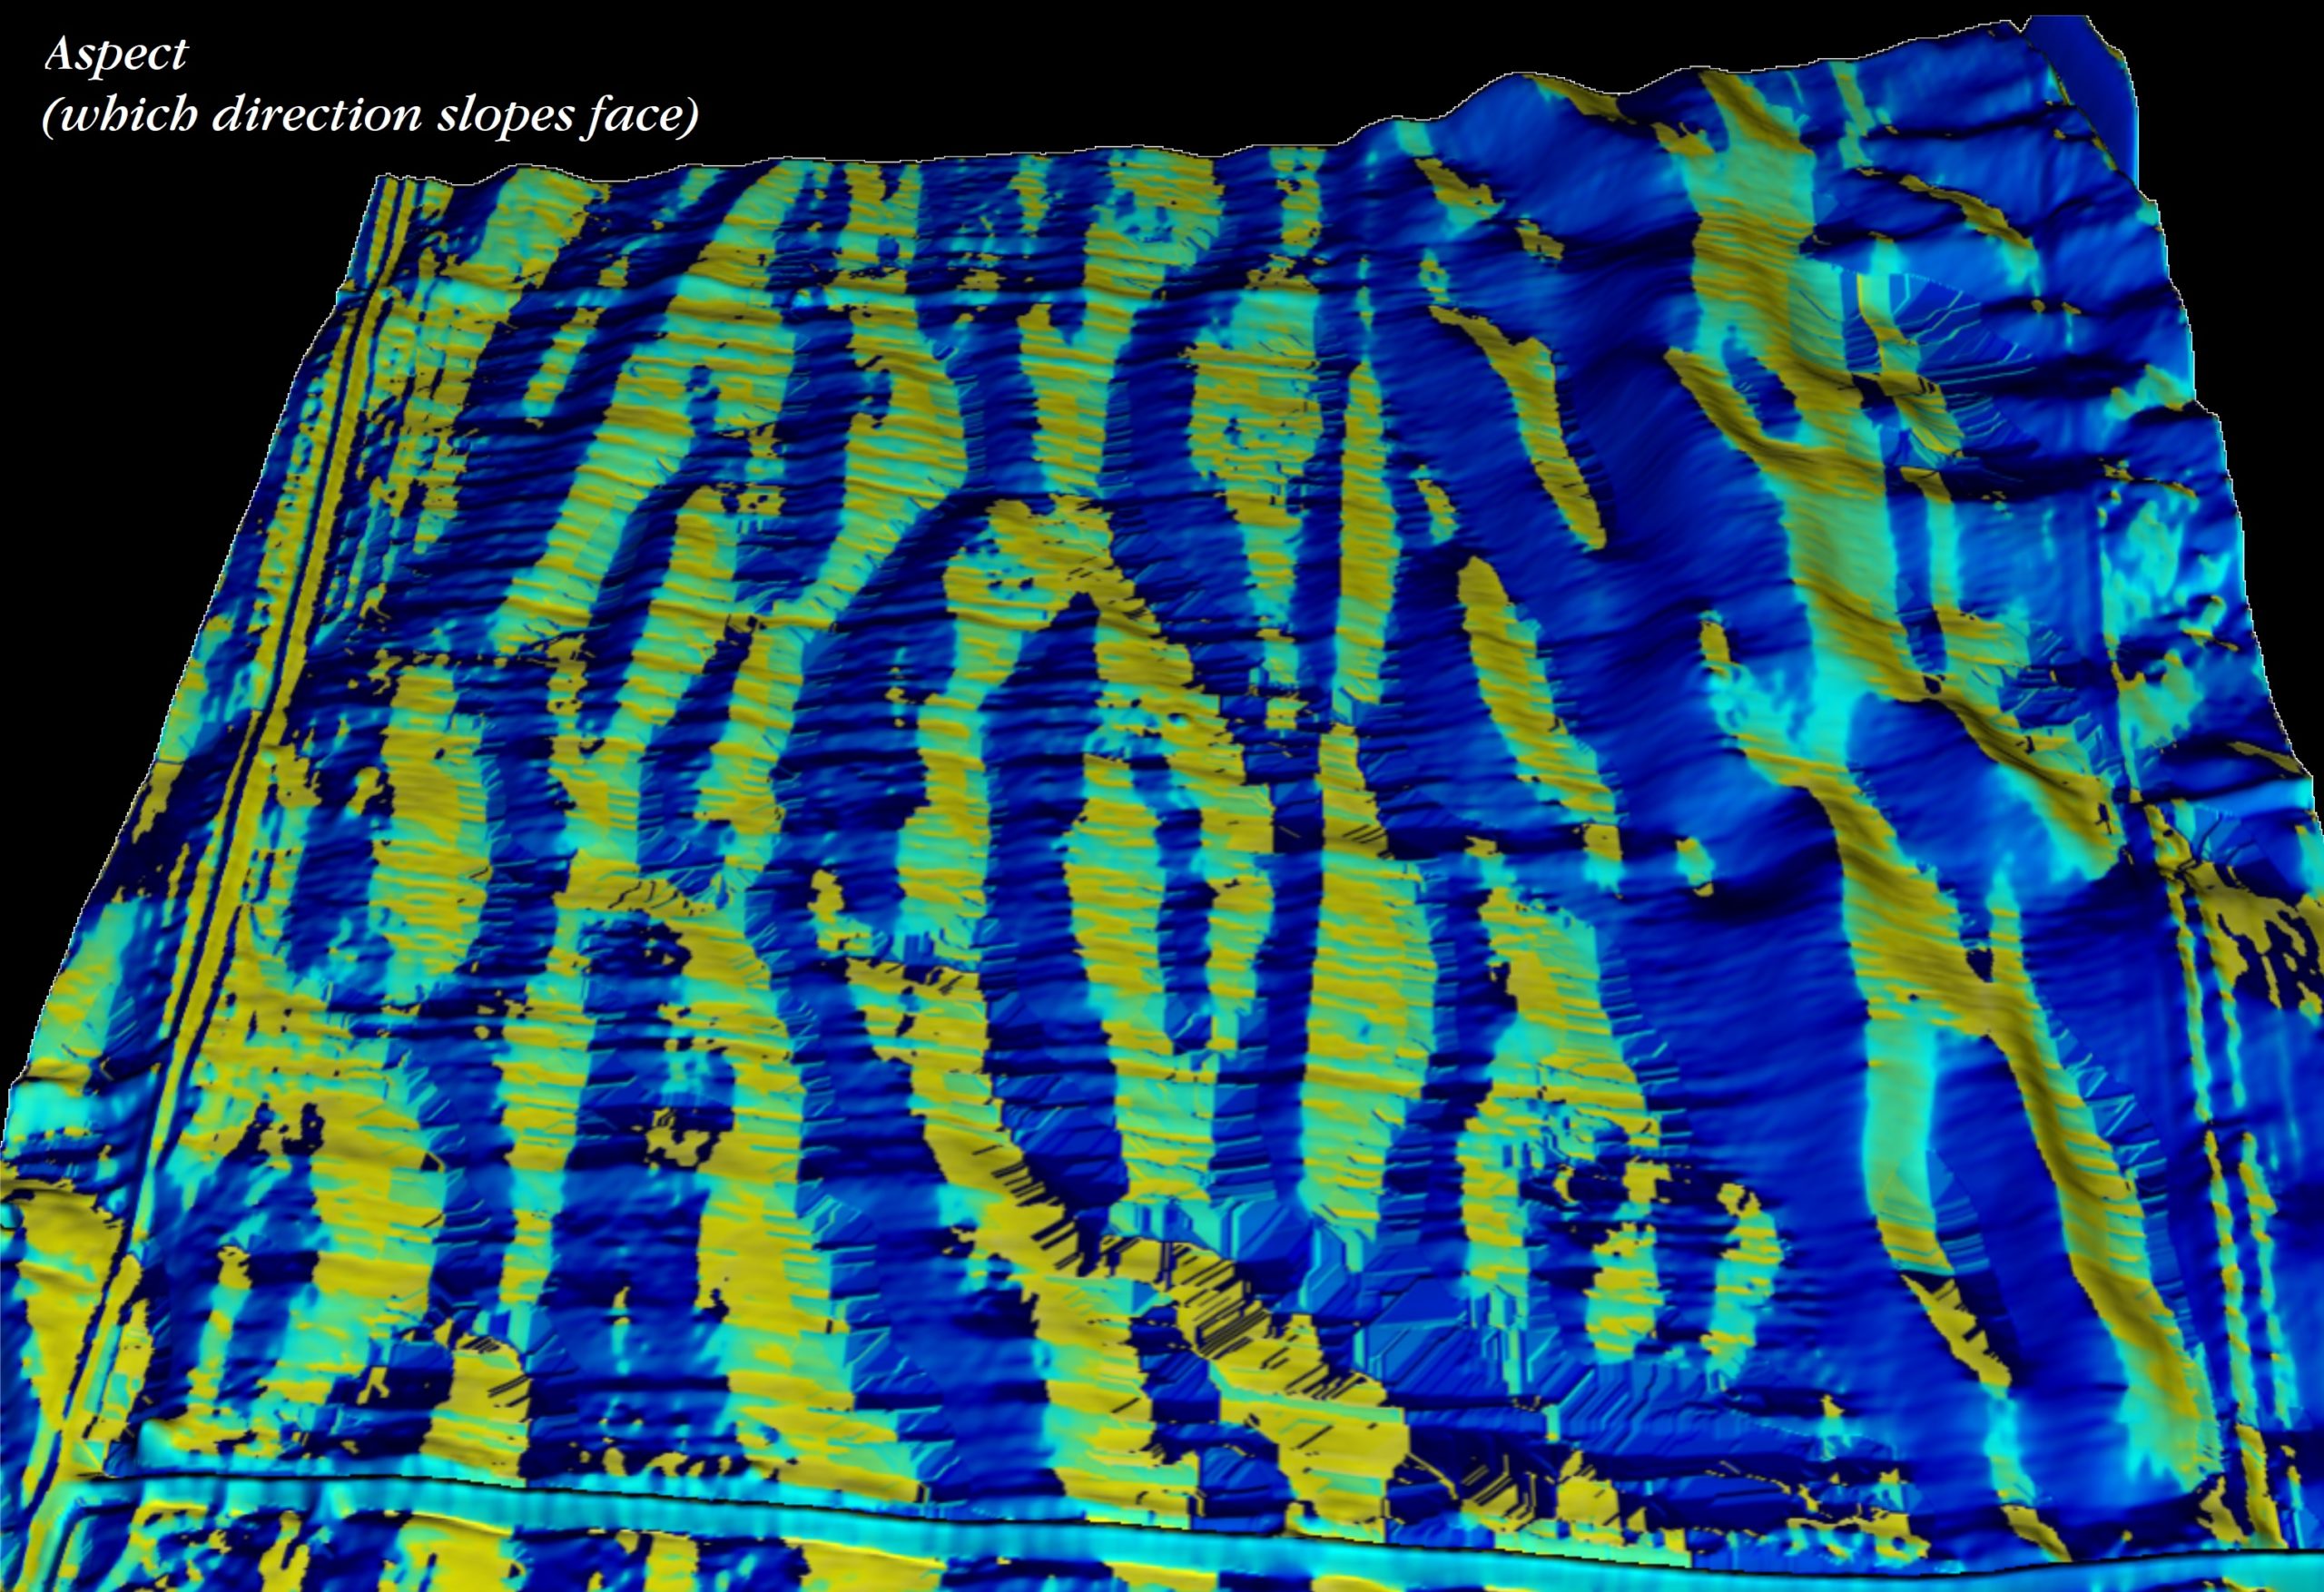
Additionally, aspect (which direction slopes face) can be a significant variable as well. For example, a south-facing slope will catch more sun, warm-up faster, and dry up faster than a north-facing slope.
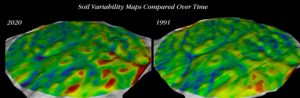
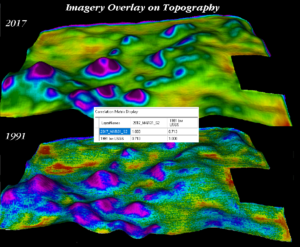
TIME
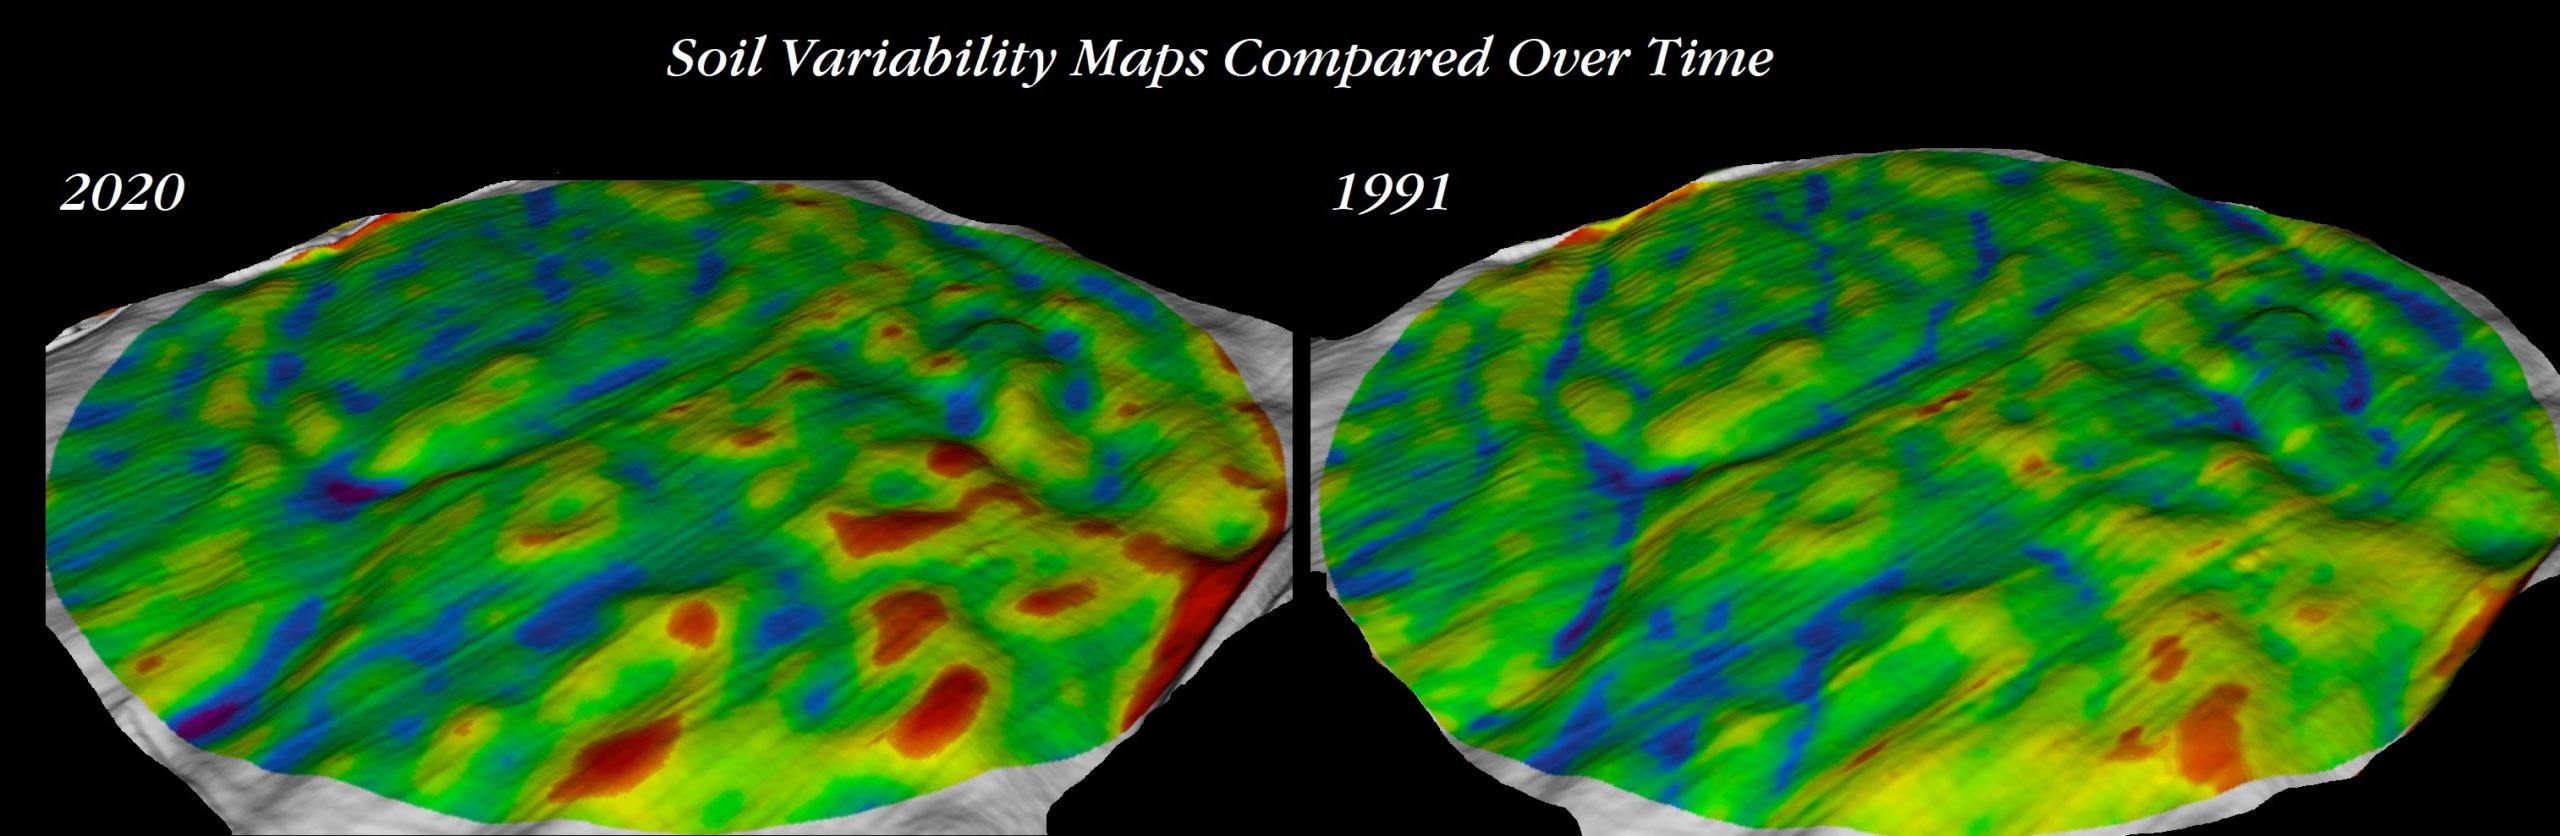
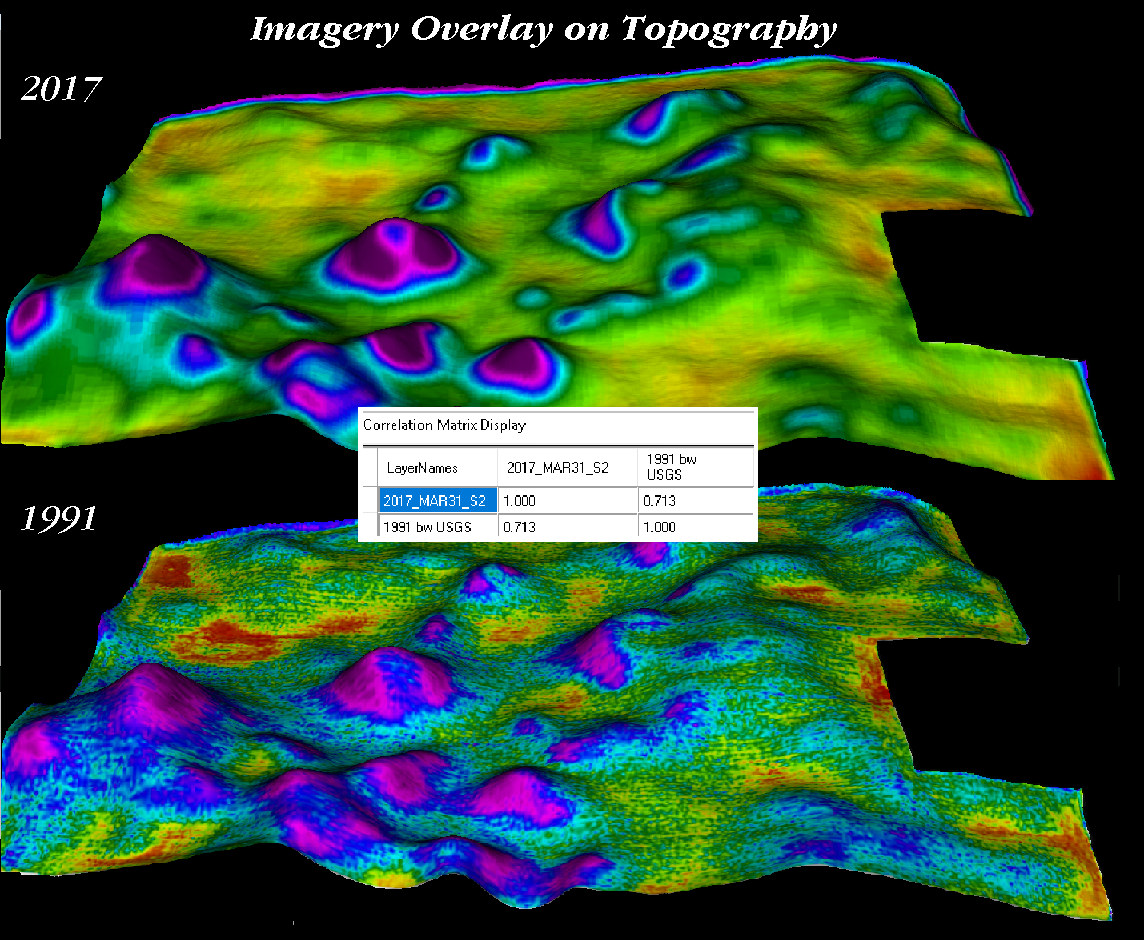
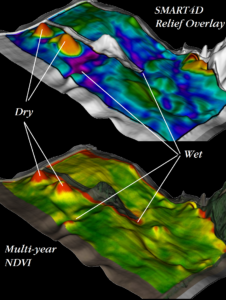
Time, or temporal analysis, is important because it can tell us how things change under different scenarios (i.e. wet years compared to dry years).
This can be useful in identifying good parts of the field from bad parts of the field and also tells us the difference in how stable or sporadic these trends are over time.
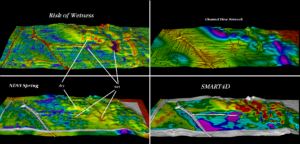
Precision Variable Rate Irrigation
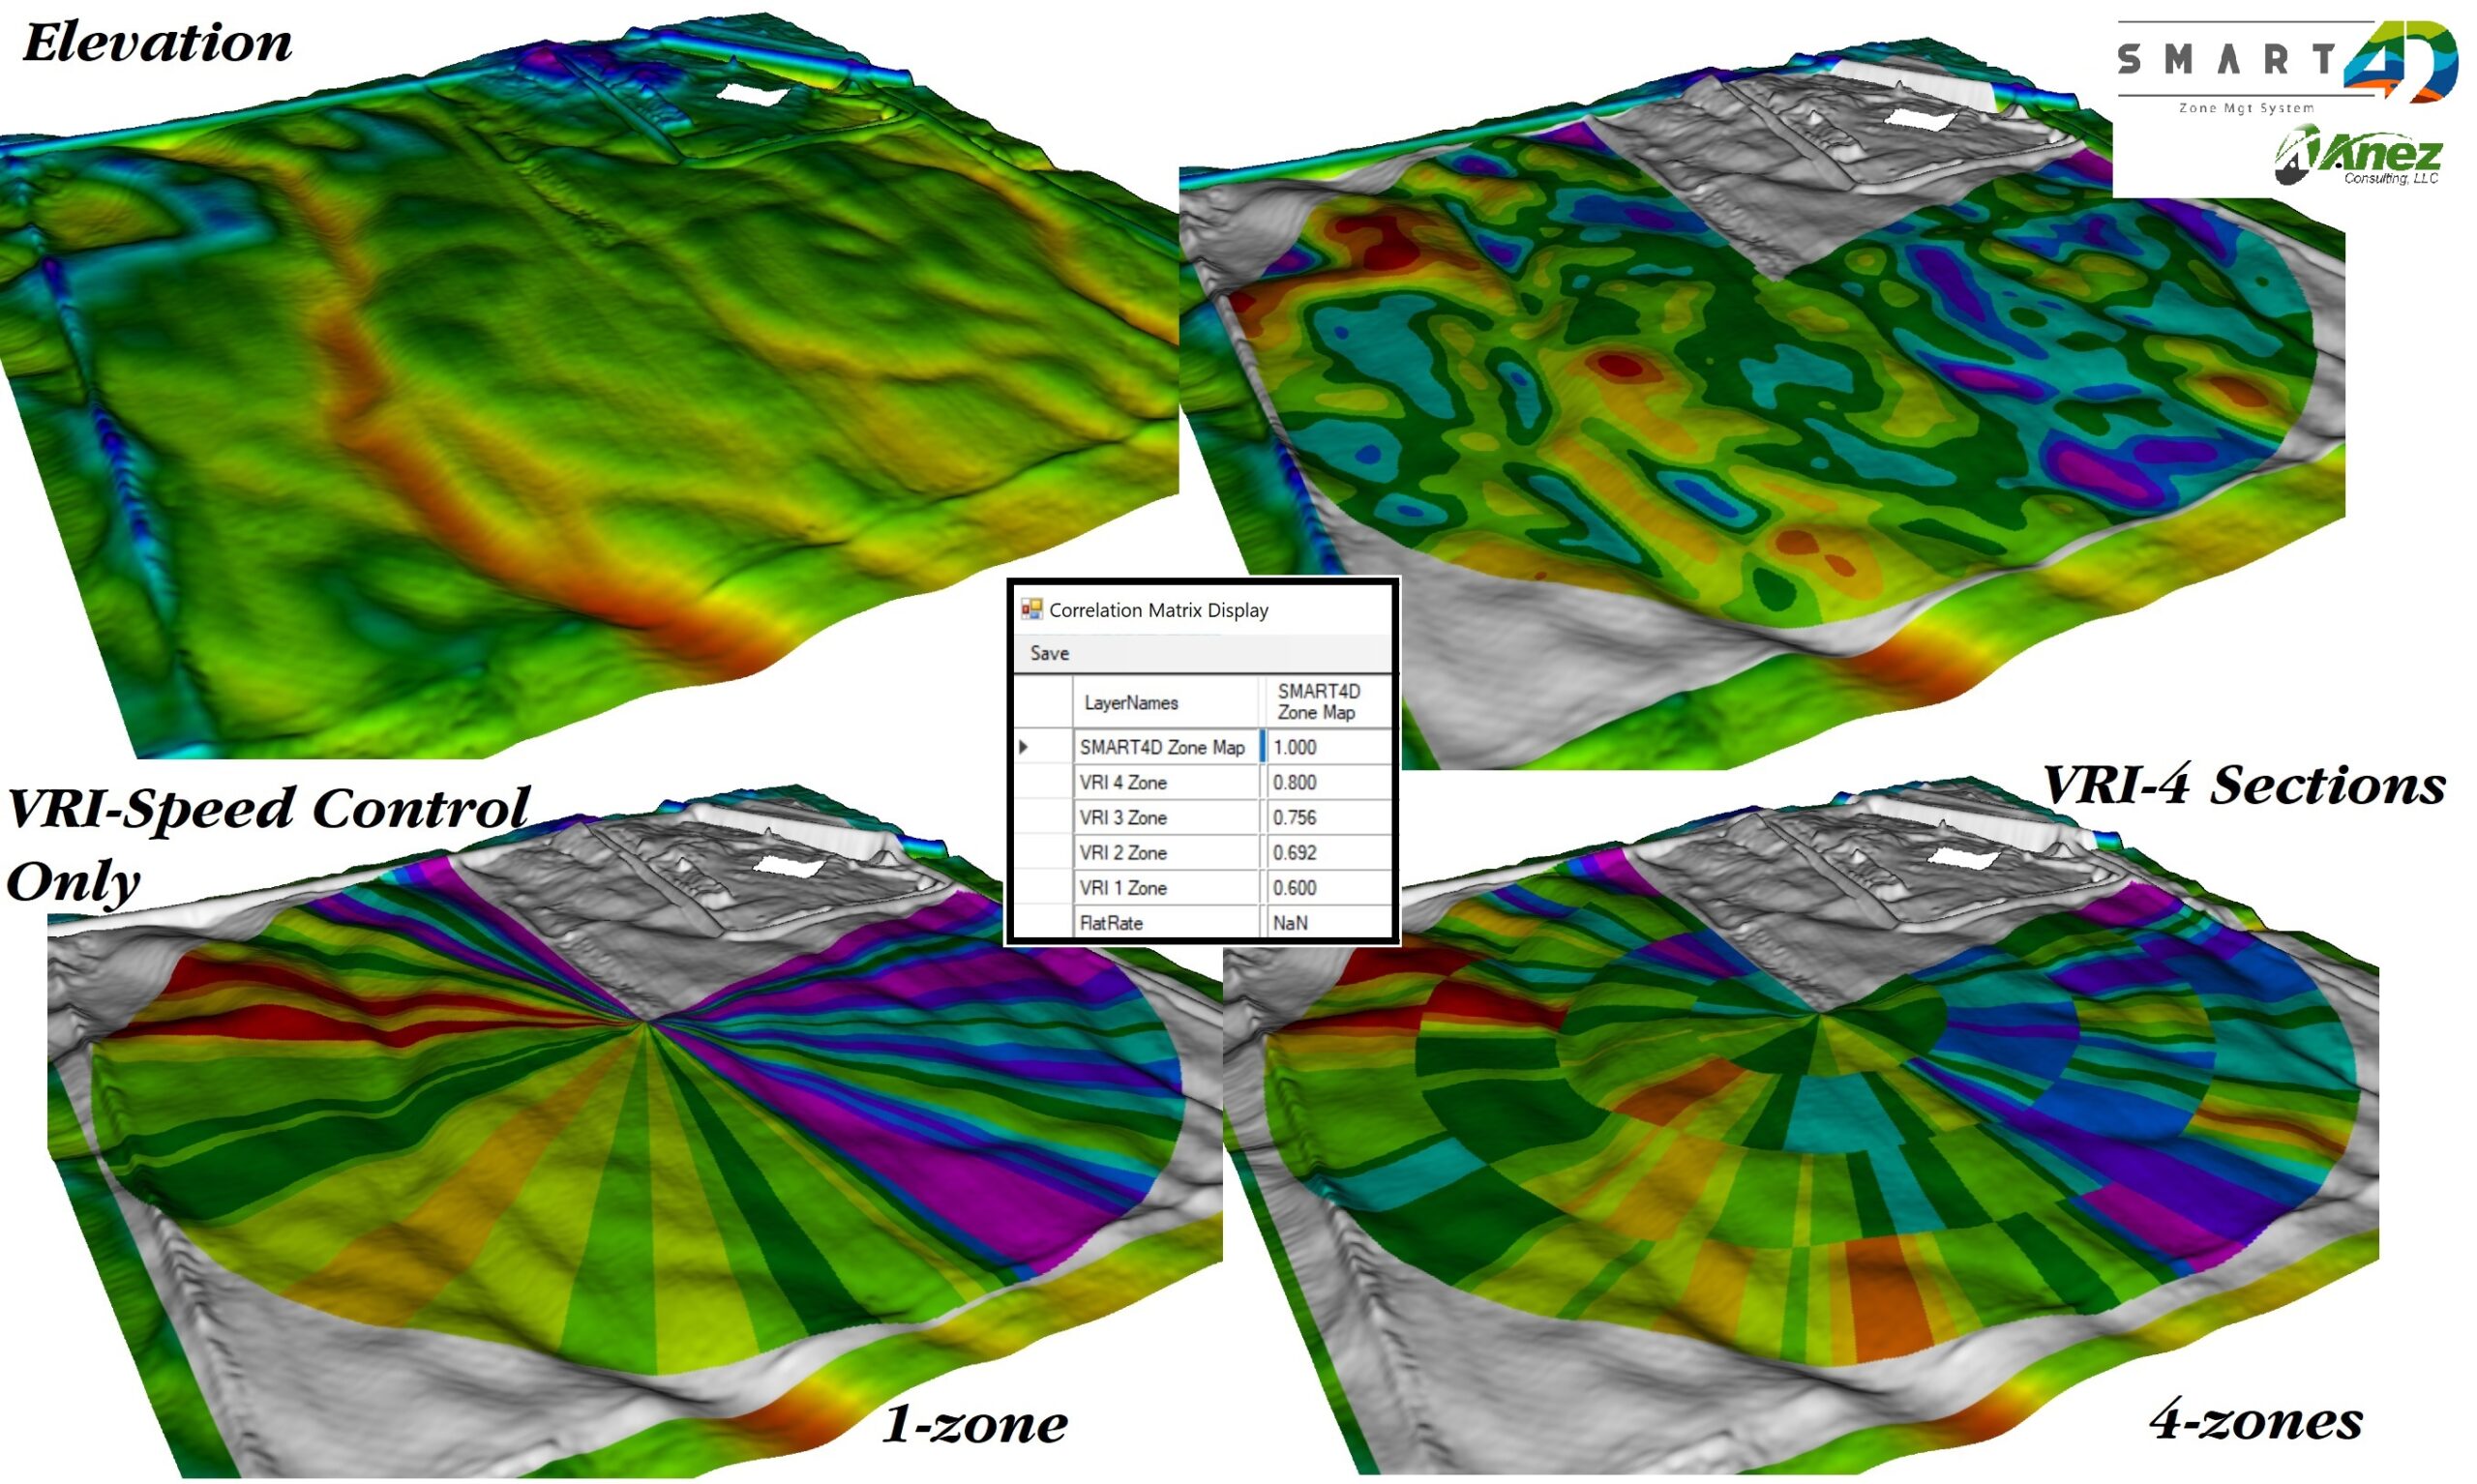
Using SMART4D to quantify the efficacy of pivot irrigation systems in spatially matching the crops need for irrigation water
SMART4D Compared to:
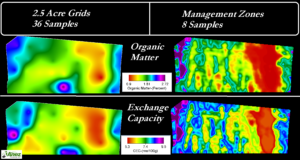
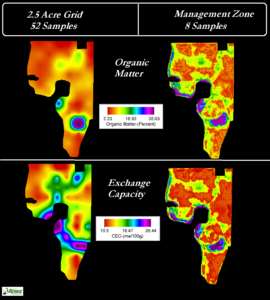
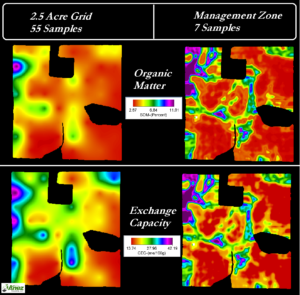
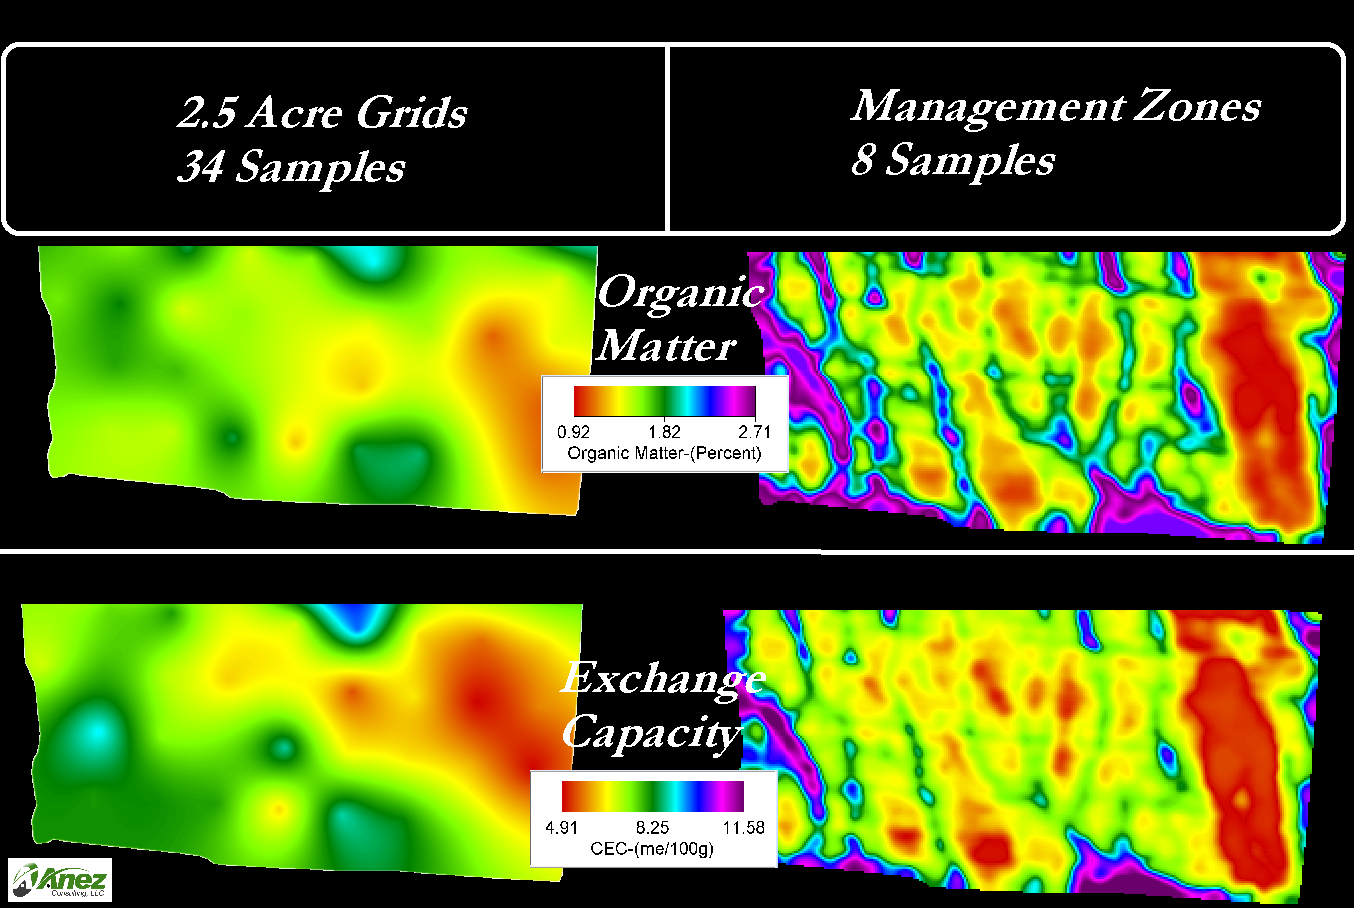
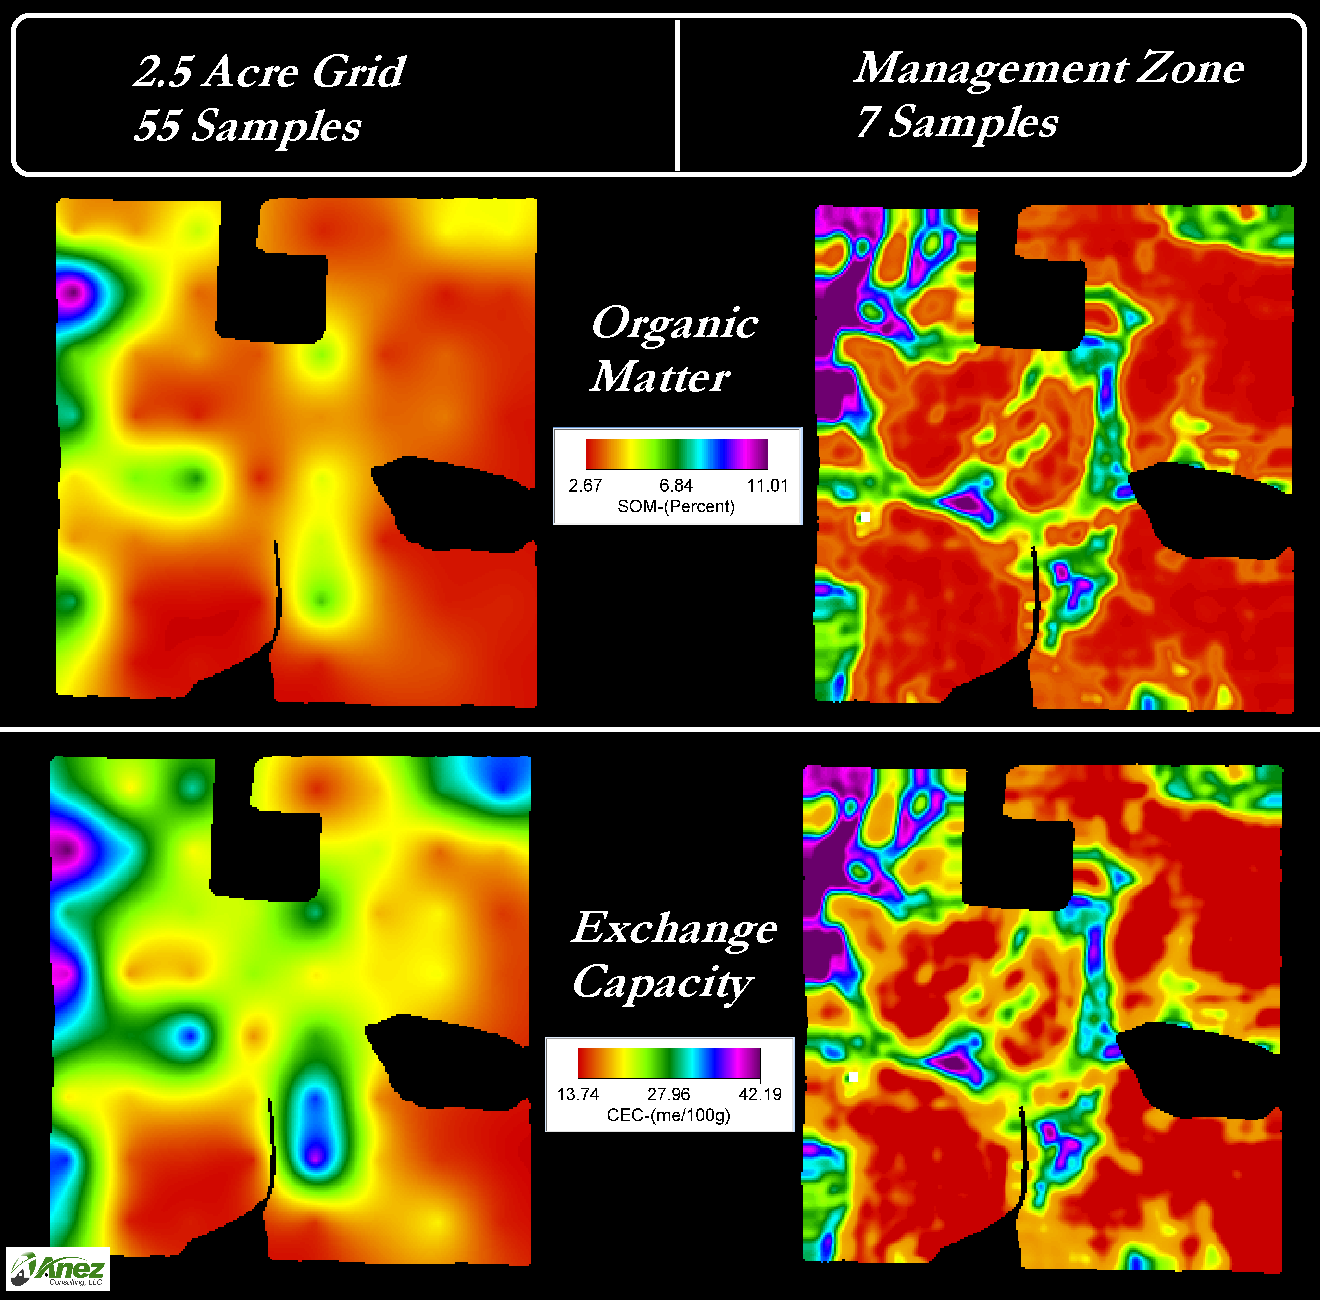
Grid Sampling
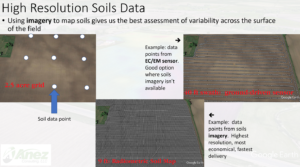
Grid sampling fails to deliver high resolution soil variability mapping that is required for accurate placement of some fertilizers, seed, and irrigation.
Grids can be better at delineating soil pH and phosphorus than zones, but only when grid sampling is done at a scale less than 1/4 acre per sample!

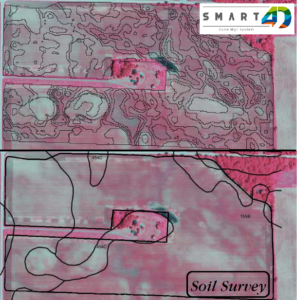
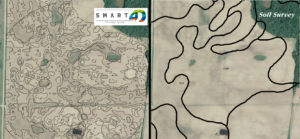
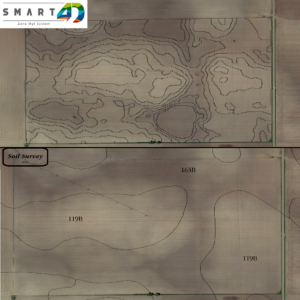
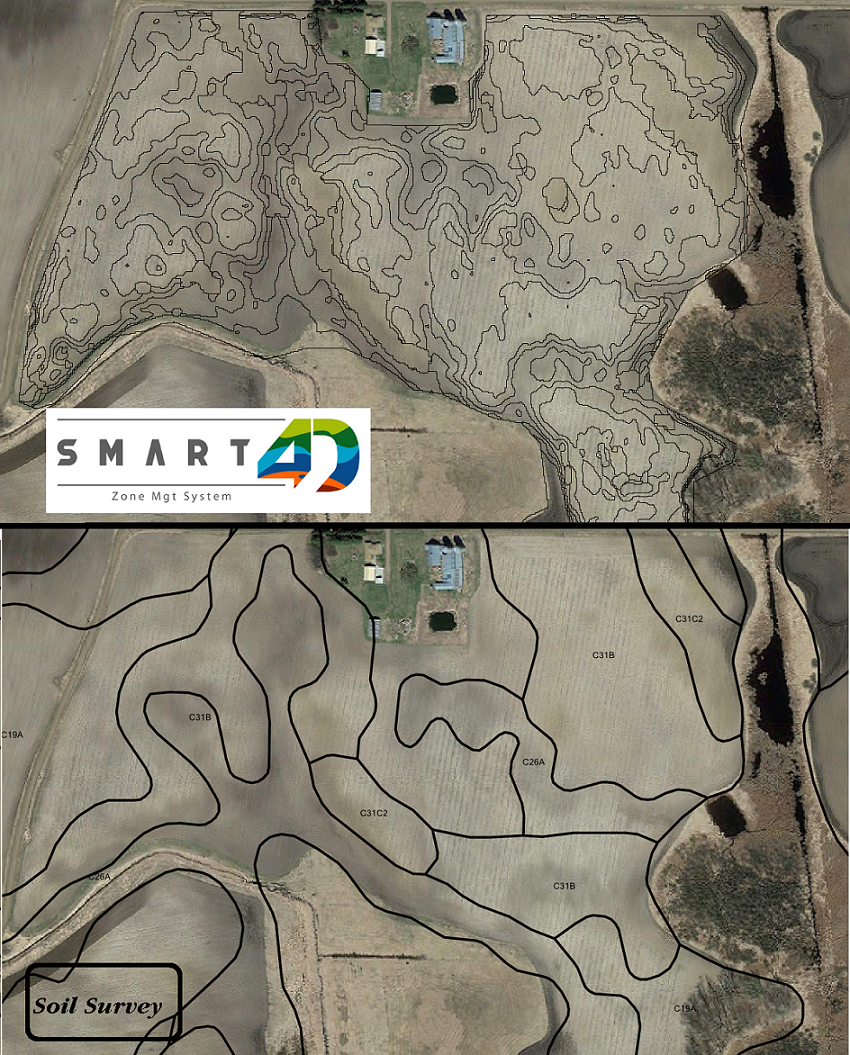
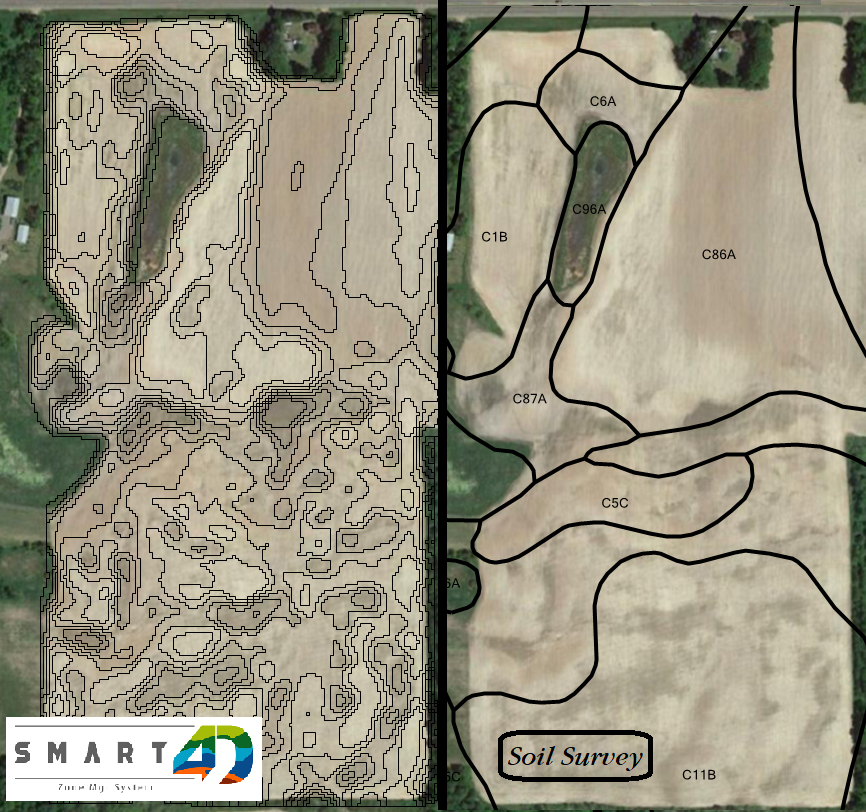
Soil Survey Map Units (SSURGO)
SSURGO soil map units were never intended to be used in precision ag and, like grids, the resolution leaves a lot to be desired.
While some in the industry still rely on these maps to create management zones, SMART4D does not employ SSURGO spatial data in zone creation.


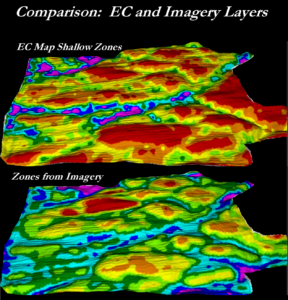
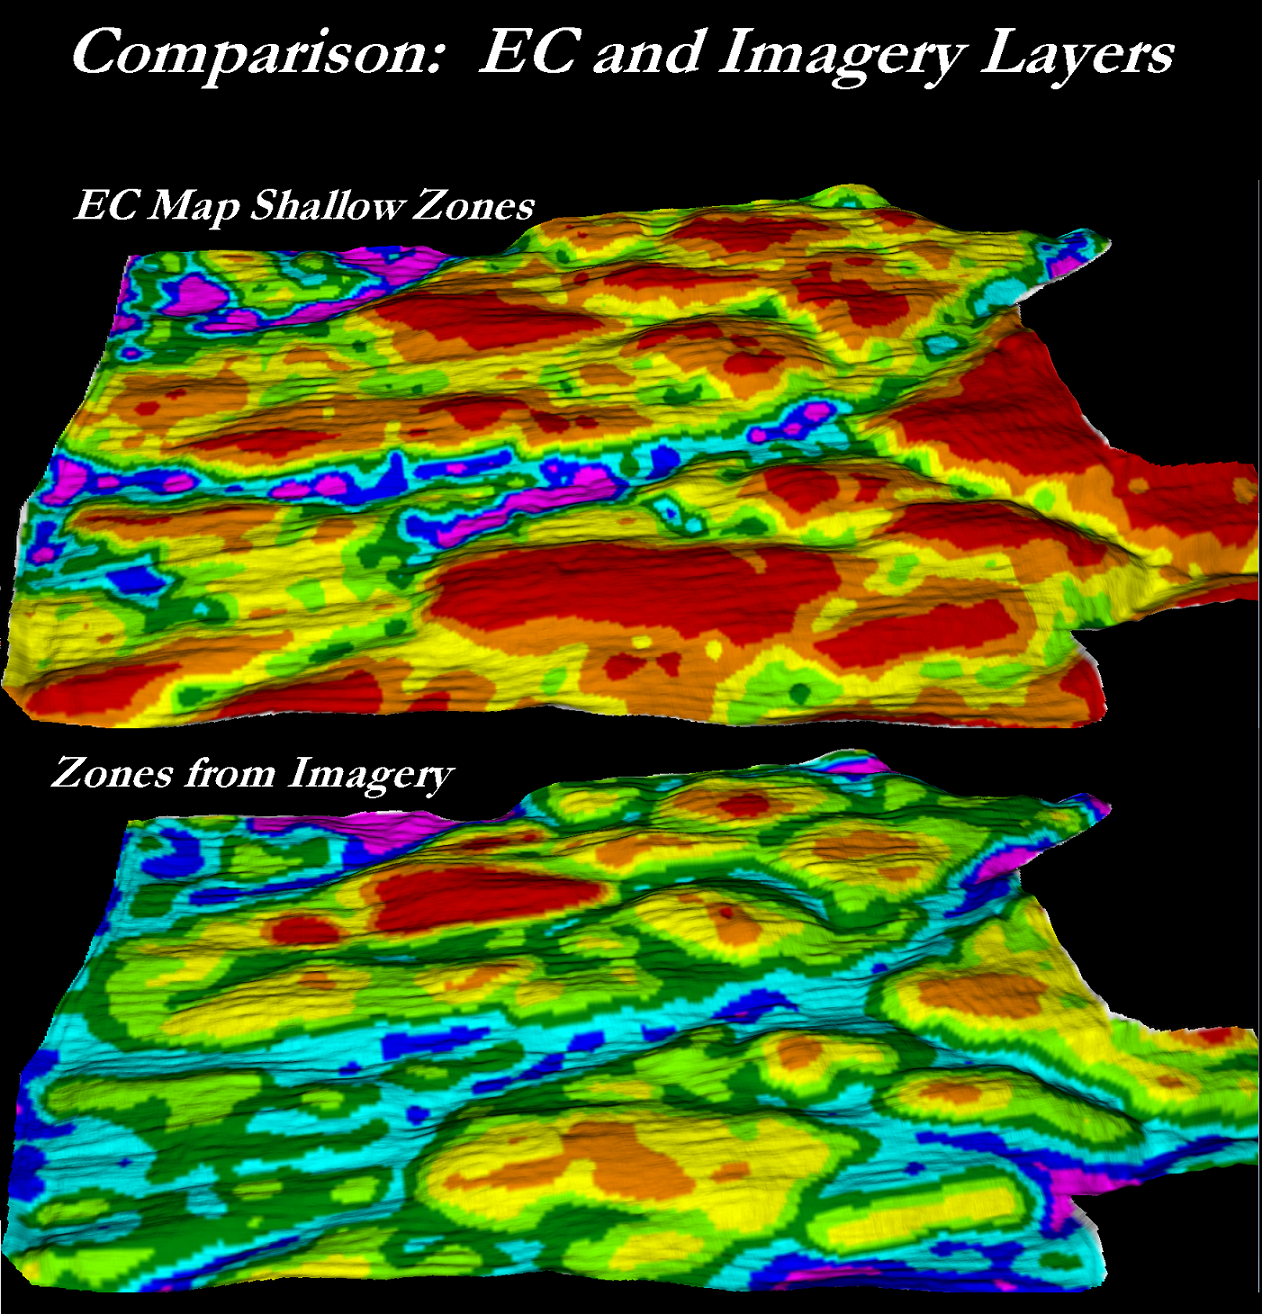
Electrical Conductivity (EC)
There are many scenarios in which EC data can be of great value. In fact, we still employ EC where the situation calls for it.
However, running EC where it is not needed incurs more cost and delays zone creation turn-around while delivering a lower resolution soil variability map than we can get from radiometric (imagery analysis) soil maps.
Scenarios where EC is a good fit: deep-rooted perennial crops (orchards, vineyards), soils where salinity is a yield-limiting factor, continual no-till (5 or more years).
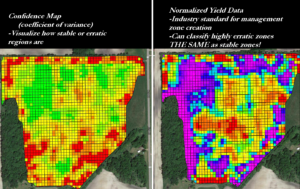
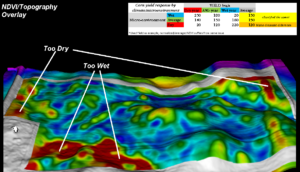
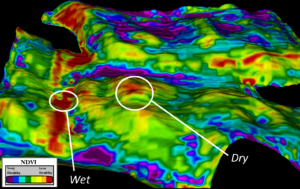
Yield Maps & NDVI-Based Zones
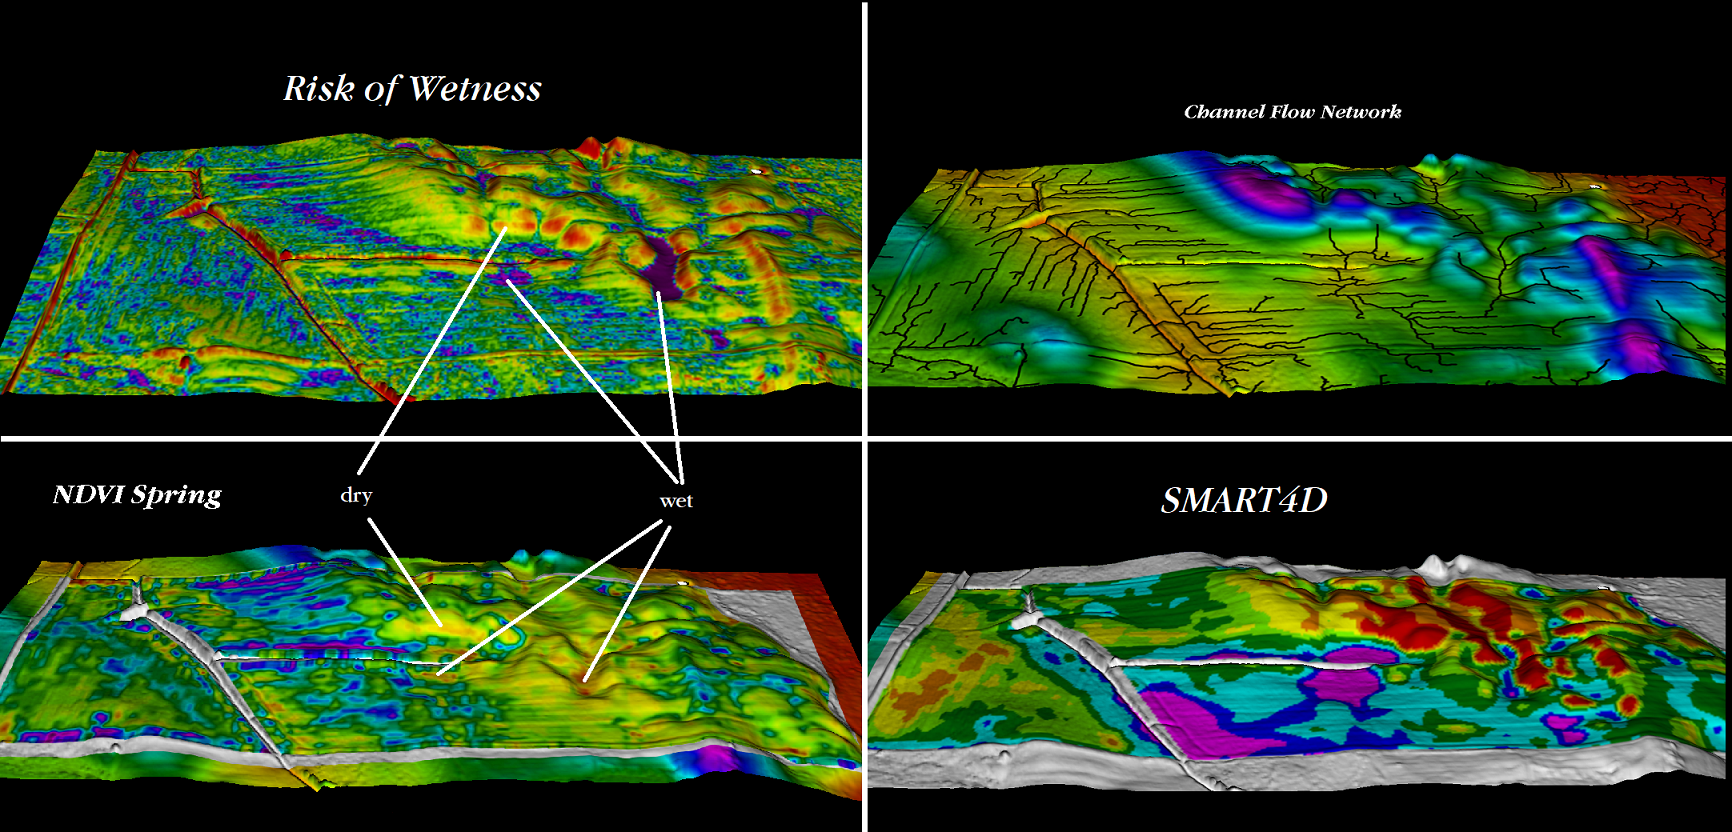
Yield maps are great for documenting what came off the field and where, if properly calibrated. NDVI, or plant health maps, are great for inferring differences in crop health and chlorophyll content.
However, there is a lot of context that is essential to creating accurate management zones that yield/NDVI maps leave out.
A classic example is the ‘bad’ spot in these maps. Is it bad because it is too dry or too wet? Maybe there was a storm event, pest, or other issue at play?
SMART4D removes a lot of ambiguity that can be present in zones based on yield/NDVI mapping.